Marketing teams are under increasing pressure to prove their impact — but what counts as “results” is shifting. Traditional performance indicators are being re-evaluated as businesses prioritize long-term value, cross-channel insights, and metrics that align with evolving buyer behaviors.
To understand how marketers are navigating this shift, Adobe for Business surveyed over 400 U.S. marketing professionals across roles, industries, and company sizes. The findings reveal not just which metrics matter in 2025, but how reporting structures, stakeholder expectations, and tool adoption are shaping what gets measured — and why.
Key findings.
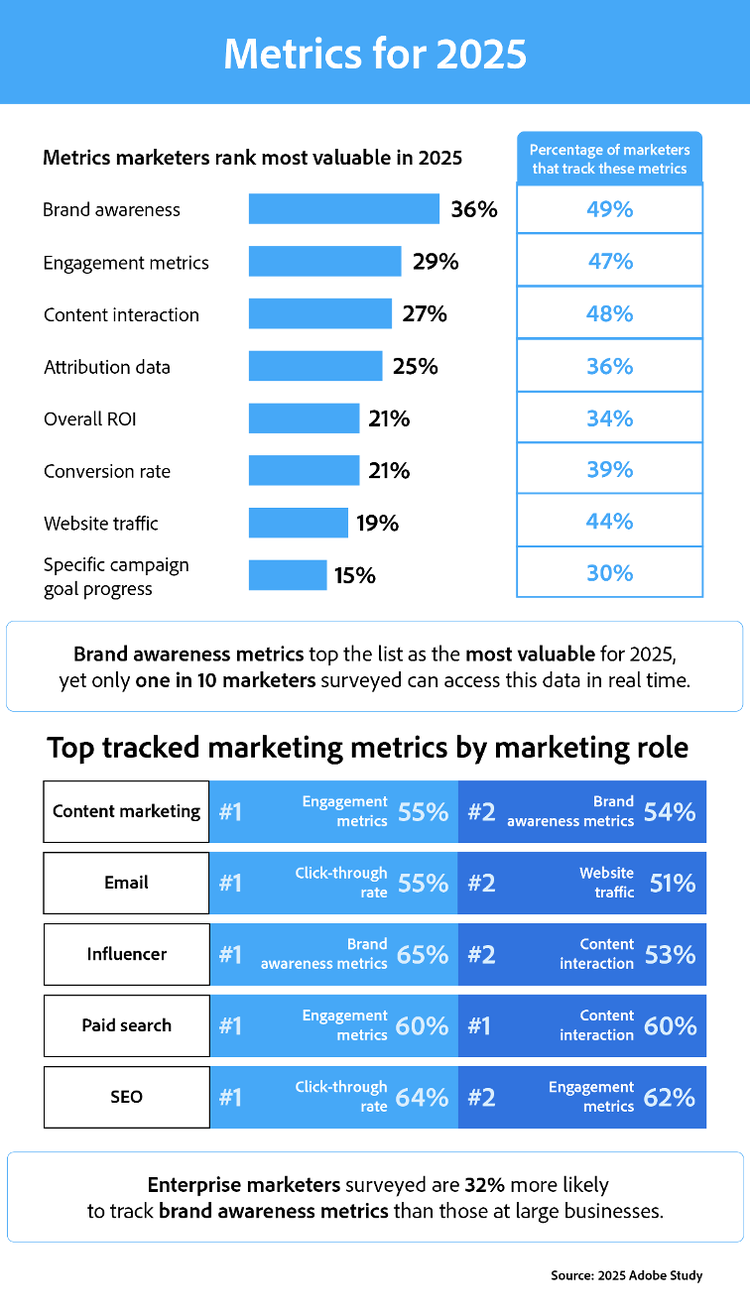
- Brand awareness metrics — including mentions, sentiment, and branded search — rank as the most valuable in 2025.
- Yet only 1 in 10 marketers have access to real-time brand data.
- ROI is named the top metric by nearly 1 in 5 marketers, but just 34% track it consistently.
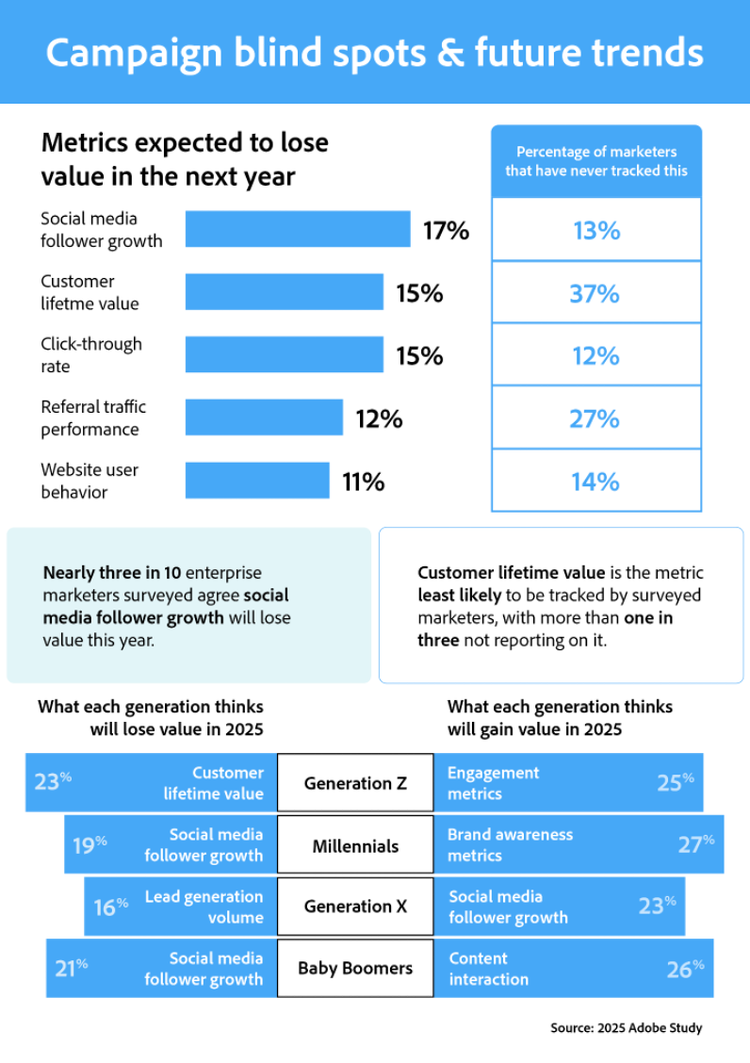
- Social media follower growth is the metric expected to lose the most value — especially among enterprise teams.
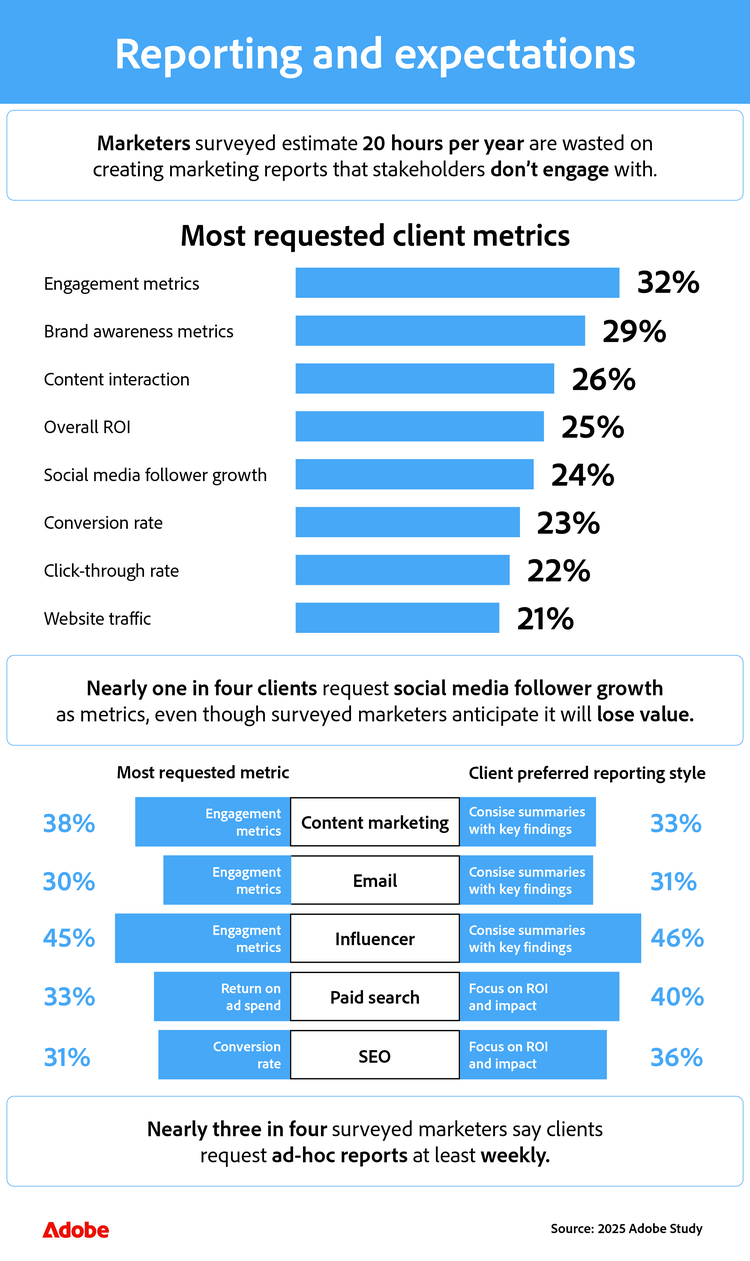
- On average, marketers spend over 20 hours annually producing reports that stakeholders don’t engage with.
- 73% of marketers say clients request weekly ad-hoc reports, widening the gap between effort and impact.
Why marketing analytics matters more in 2025.
Marketing analytics enables teams to move beyond guesswork and tie performance to outcomes. With the right tools and techniques, teams can understand what works, prove ROI, and improve the customer journey across every touchpoint.
For mid-market to enterprise organizations in sectors like retail, technology, and financial services, analytics helps simplify complex journeys, optimize resource allocation, and align marketing activity with revenue goals.
This post will cover:
- What is marketing analytics?
- What can marketing analytics evaluate?
- Beyond ROI: Marketers are refocusing on brand and engagement
- Engagement and content metrics are gaining traction
- ROI remains critical — but undermeasured
- Role-based metrics: Why context matters
- Metrics falling out of favor in 2025
- Making customer lifetime value (CLV) actionable with Adobe Real-Time CDP and Adobe Customer Journey Analytics
- Components of an effective marketing analytics strategy
- Practical analytics techniques marketers are using
- How marketing analytics is used in the real world
- Why reporting still feels broken
- What stakeholders want from reports
- Five measurement methods to assess marketing performance
- Getting started with marketing analytics
- How Adobe Customer Journey Analytics helps