Data collection and processing
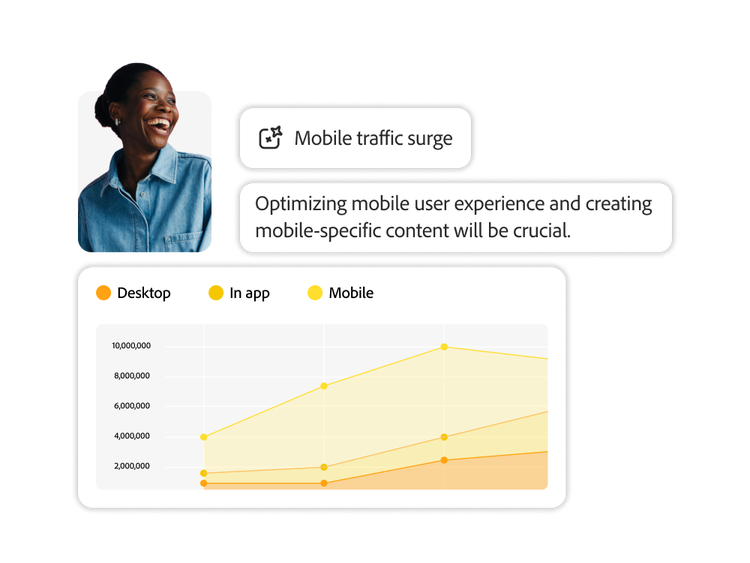
Collect digital behavioral data in real time from your paid channels and your owned and operated channels and convert it into a purpose-built format ready for fast, unlimited, and in-the-moment visitor profile analysis.
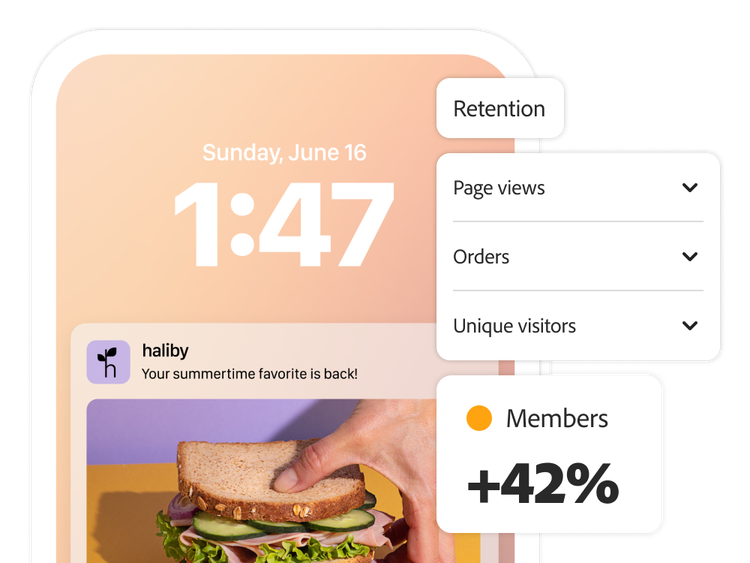
- Data collection. Ingest data into Adobe Experience Platform from any digital source including web, mobile, kiosks, or streaming media.
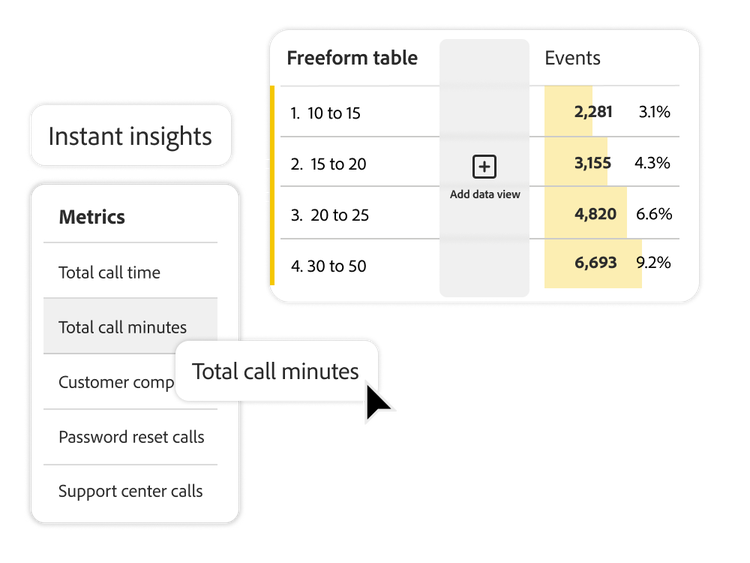
- Data views. Adjust your data views and fields of post-processed data on-demand to get answers to questions, update analyses, and fix data errors — instantly and without altering or destroying the original dataset.
- Data governance. Use alerts, policies, residency, and other features to prevent sensitive data access and manage storage by geography and regulations.