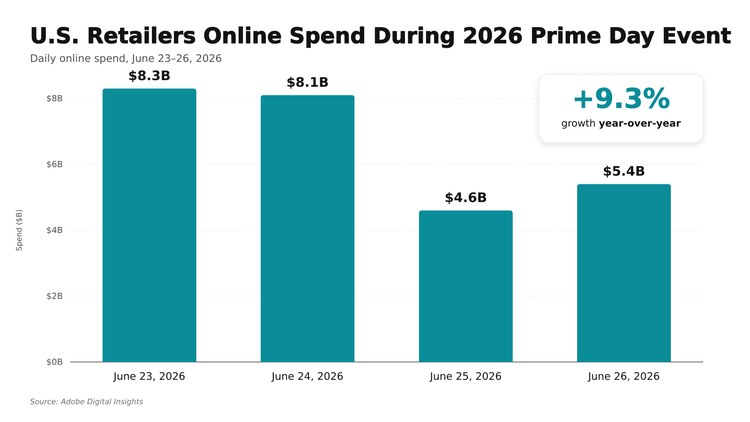
Adobe released final figures for the Prime Day event (23 June to 26, 2026), highlighting consumer spend and other trends across U.S. retailers. Adobe’s report provides a comprehensive view of U.S. e-commerce by analysing direct online transactions, covering more than 1 trillion visits to U.S. retail sites, 100 million SKUs and 18 product categories.
Competitive discounts drove another e-commerce record.
U.S. retailers drove $26.4 billion in online spend from 23 June (Tuesday) to 26 June (Friday), representing 9.3% year-over-year (YoY) growth, trending above Adobe’s initial forecast of $26.3 billion (up 9% YoY). This is changing the shape of the summer shopping season, which is beginning to rival the holiday period. As a comparison point, consumers spent $32.4 billion across Thanksgiving, Black Friday and Cyber Monday in 2025. Mobile continued to be the dominant transaction channel, driving 54.2% of online sales (vs. desktop shopping) during the Prime Day event. This represented $14.2 billion in overall spend, an all-time high.
Competitive discounts drove online demand, as shoppers have been conditioned to wait for big promotional periods to hit ‘buy’ on products they’ve had their eyes on. Consumers found great deals that were on par with last year’s Prime Day event, with discounts for electronics peaking at 24% off the listed price (vs. 23% in 2025). Strong discounts were also seen in apparel at 24% (vs. 24%), toys at 20% (vs. 19%), televisions at 19% (vs. 18%), appliances at 16% (vs. 16%), furniture at 16% (vs. 15%), computers at 15% (vs. 13%) and sporting goods at 10% (vs. 9%).
Some consumers also opted for greater payment flexibility. During the Prime Day event, ‘Buy Now, Pay Later’ (BNPL) orders accounted for 6.6% of online orders. This amounted to $2.1 billion in online spend from 23 June to 26, representing 9.5% growth YoY.
Shoppers gravitated toward pricier goods.
Strong discounts during the Prime Day event drove many shoppers to “trade up” to higher-ticket items. Across all categories tracked by Adobe, the share of the most expensive goods increased by 19% (compared to average levels year-to-date). In electronics, the share of the most expensive goods rose significantly by 51%. Adobe also observed consumers trading up in categories such as toys (up 37% YoY), appliances (up 30% YoY), personal care products (up 27% YoY), furniture (up 24% YoY), sporting goods (up 24% YoY) and apparel (up 11% YoY). Categories where consumers embraced lower priced products included home and garden (share of most expensive goods down 5%) and grocery (down 4%).
Shoppers continued to embrace AI-powered chat services and browsers to research products and find deals. In the first five months of the year (Jan-May), AI traffic to U.S. retail sites (measured by shoppers clicking a link) increased by 235% YoY. The trend continued across the Prime Day event, where it was up 89%.
Once these individuals landed on a retail site, they converted 40% better than non-AI channels (such as paid search, email and social media), a measure of visits that become actual purchases. This is a notable shift from the Prime Day event last year, where AI traffic converted 23% worse. And while the overall volume of AI traffic remains modest compared to other major channels, the data shows the impact of AI in the shopping journey, shortening the time it takes for consumers to confidently get the information they need.
What consumers were buying during the Prime Day event.
At the category level, online sales across U.S. retailers were driven by electronics (up 120% vs average daily sales in June 2026), appliances (up 90%), tools and do-it-yourself (up 70%), home and garden (up 65%) and furniture and bedding (up 55%). At the product level, Adobe observed upticks in the following areas:
- Health and wellness: Online purchases of smartwatches were up 120% (vs. average daily sales in June 2026), with exercise equipment up 85% and activewear up 50%.
- Purchases for the kids: Back-to-school shopping remained a sales driver, with upticks seen across kids’ apparel (up 140% vs. average daily sales in June 2026), lunch boxes (up 105%) and backpacks (up 115%). Additionally, purchases of baby products were up, including pushchairs (up 195%), car seats (up 140%), formula (up 75%) and nappies/wipes (up 75%).
- Purchases for the home: Consumers took advantage of deals to refresh their living spaces. Online purchases of bedroom/bathroom linens were up 130% (vs. average daily sales in June 2026), with mattresses up 80% and bedroom furniture up 45%. In other parts of the home, bathroom furniture was up 65% and bathroom fixtures were up 55%. In the kitchen, cookware was up 75%, other kitchenware was up 50%, kitchen and dining furniture was up 40% and kitchen fixtures were up 35%.
- Everyday essentials: Personal hygiene products (oral care, shampoo, antiperspirant) were up 125% and household goods (trash bags, detergents, paper products) were up 60%.
- Summer travel: As some consumers prepare for the upcoming travel season, online purchases were up in areas like luggage (up 95%), car seats (up 140%), noise-cancelling headphones (up 155%), portable chargers (up 70%), travel-size toiletries (up 70%) and portable fans (up 55%).
Adobe tracked the impact of marketing investments during the Prime Day event, profiling how different channels contribute to revenue share. Social media continues to make a big impact, driving a 4.4% share of revenue but growing the fastest (up 15.8% YoY). Affiliates and partners — which include social media influencers — saw strong growth as well (21.3% share, up 7.0% YoY).
Notably, influencers converted shoppers (individuals making a purchase after seeing influencer content) 11 times more than social networks overall. Affiliates and partners also drove the highest 'add-to-basket rates' at 9%, along with checkout initiation at 56%, outpacing social media overall at 3% and 28%, respectively. This highlights the stronger conversion impact from affiliate and partner channels, with social continuing to play more of an upper-funnel (awareness) role.
Vivek is the director of Adobe Digital Insights who has worked with some of the largest CPG & Technology organisations, in the world, to drive key digital marketing & data science initiatives. As the Director for Adobe Digital Insights (ADI), he launched & spearheads the popular Adobe DEI (Digital Economy Index) & Holiday Retail reports, as well as other industry reports that profile emerging technology, creativity and travel trends.