
The Prime Day event is an industrywide moment for e-commerce, with discounts happening broadly across U.S. retailers. Adobe released data covering the period from 8 July to 11, with insights on consumer spending online, mobile shopping, generative AI traffic and more.
Adobe’s report provides the most comprehensive view into U.S. e-commerce by analysing direct transactions online, covering over 1 trillion visits to U.S. retail sites, 100 million SKUs and 18 product categories.
A new benchmark for summer e-commerce.
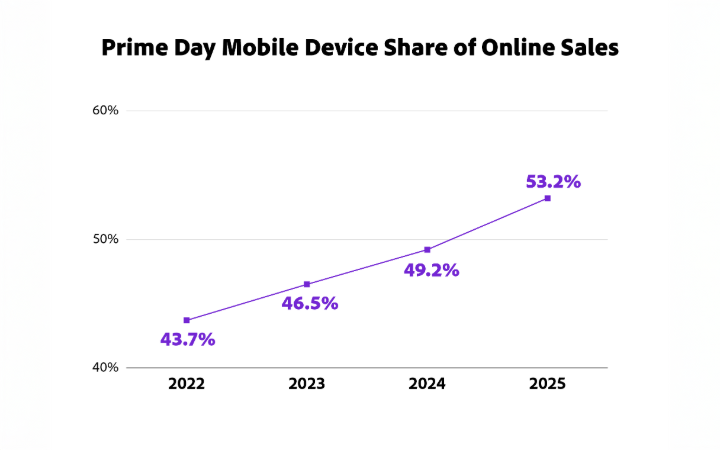
U.S. retailers drove $24.1 billion in online spend from 8 July (Tuesday) to 11 July (Friday), representing 30.3% growth year-over-year (YoY). This is more than two Black Fridays—which drove $10.8 billion in online spend during the 2024 holiday shopping season—and sets a new benchmark for the summer shopping season. Mobile was the dominant transaction channel during the Prime Day event, driving the majority of sales (53.2% sharevs desktop shopping) and contributing $12.8 billion in online spend.
Competitive discounts(details below) across U.S. retailers drove price-sensitive shoppers to spend in categories such as appliances, where online sales were up 112% (compared to average daily sales in June 2025). Other categories with strong growth included office supplies (up 105%), electronics (up 95%), books (up 81%), tools & do-it-yourself (up 76%), home & garden (up 58%) and baby & toddler (up 55%).
Hot sellers included products such as kids’ apparel (up 250%), home security products (up 185%), refrigerators & freezers (up 160%), games (up 160%), headphones & speakers (up 155%), car seats (up 145%), luggage (up 145%), vacuum cleaners (up 140%), power tools (up 135%), computers (up 125%), washers & dryers (up 125%), smartphone accessories (up 120%), storage furniture (up 120%), TVs (up 90%), small kitchen appliances (up 90%) and exercise equipment (up 80%).
The Prime Day event has also been cemented as a “back-to-school” shopping moment, as consumers took advantage of deals and got a head start on purchases for the upcoming school season. School supplies (such as backpacks, lunchboxes, binders, calculators and kids' apparel) were up 175%. And dorm essentials (microwaves, mini fridges, bedroom linens, twin/full mattresses, laundry & cleaning products and storage products) were up 84%.
Consumers embraced generative AI and social influencers.
Shoppers are increasingly using generative AI-powered chat services and browsers as a shopping assistant. During the Prime Day event, generative AI traffic to U.S. retail sites (measured by shoppers clicking a link) increased by3,300% YoY. And while AI-driven traffic remains modest compared to other channels (paid search, email), the growth shows the impact of AI on shoppers looking for deals or specific product details.
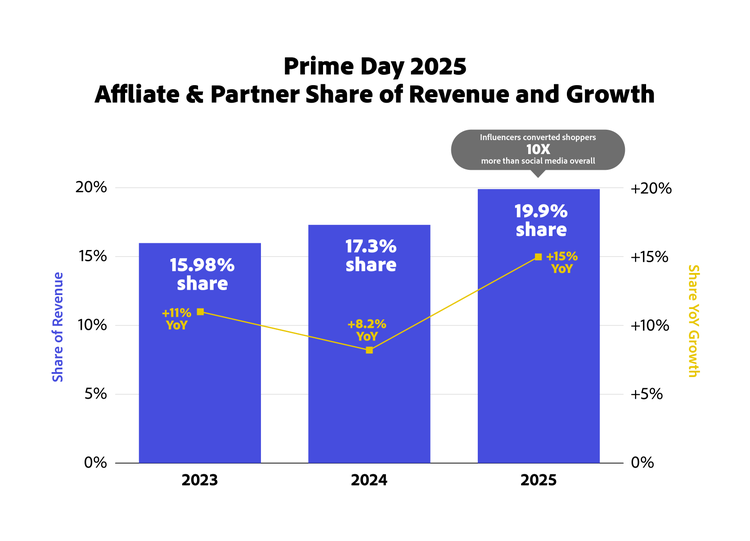
Social influencersalso played a major role in driving traffic to U.S. retail sites during the Prime Day event. While paid search remained the top driver of retail sales online (28.5% share of revenue, up 5.6% YoY), affiliates and partners—which includes social media influencers — saw a greater lift (19.9% share, up 15% YoY). Adobe’s data also showed that influencers converted shoppers (individuals making a purchase after seeing influencer content) 10 times more than social media overall.
Additional Adobe insights.
- Competitive discounts drove online demand: U.S. retailers leaned into discounts to drive growth, with a consumer that remains price sensitive. Shoppers found great deals that trended above last year’s Prime Day event, with discounts for apparel peaking at 24% off listed price (vs. 20% in 2024). Strong discounts were also seen in electronics at 23% (vs. 23%), toys at 19% (vs. 15%), televisions at 18% (vs. 16%), appliances at 17% (vs. 14%), furniture at 16% (vs. 16%), computers at 13% (vs. 11%) and sporting goods at 11% (vs. 11%).
- Consumers gravitated towards pricier goods: Strong discounts during the Prime Day event drove many shoppers to “trade up” to higher-ticket items. Across all categories tracked by Adobe, the share of the most expensive goods increased by 20% (compared to average levels year-to-date). In electronics, the share of the most expensive goods rose significantly by 57%. Adobe also observed consumers trading up in categories such as appliances (up 36%), sporting goods (up 30%), furniture (up 28%), toys (up 19%), personal care (up 13%) and apparel (up 11%). Categories where consumers embraced lower priced products included grocery (share of most expensive goods down 7%) and home & garden (down 2%).
- Buy Now Pay Later usage saw uptick: Consumers continue to embrace more flexible ways to manage their budgets. During the Prime Day event, ‘Buy Now Pay Later’ (BNPL) orders accounted for 8.1% of online orders (up from 7.4% in 2024). This amounted to $2.0 billion in online spend from 8 July to 11, representing 33.3% growth YoY. In an Adobe survey of 1,000 U.S. consumers (conducted June 2025), respondents reported using BNPL most in product categories such as apparel, electronics, home goods and health & beauty.
Impact of inflation: Strong spending during the Prime Day event was driven by net-new demand, as opposed to higher prices. The Adobe Digital Price Index, which tracks online prices across 18 product categories, shows that e-commerce prices have fallen for 34 months—down 2.1% YoY in June 2025. Adobe’s numbers are not adjusted for inflation, but if online inflation were factored in, there would be even higher growth in topline consumer spend.