Inconsistent, redundant and poorly structured data costs teams hours of rework and produces analytics results no one can trust. Data normalisation is the discipline that eliminates those problems before they reach a report, a model or a customer experience.
In this article:
What is data normalisation?
Data normalisation is the process of organising data so that it is consistent, non-redundant and structured to support reliable querying and analysis. A simple example illustrates why it matters. If one system stores a customer's country as US, another as United States, and a third as USA, no join across those systems will produce correct results until the values are normalised to a single standard. That kind of inconsistency is not an edge case. It is the default state of any organisation that collects data from more than one source.
Two distinct disciplines use the term data normalisation, and both matter to data teams.
- Relational database normalisation structures tables to eliminate duplicate data and enforce logical dependencies. It is relevant to anyone designing or maintaining a database schema and it follows a set of progressive rules called normal forms.
- Numerical normalisation rescales numeric values into a common range or distribution. It is relevant to anyone building machine learning models or feeding data into algorithms sensitive to scale, such as clustering or regression.
In an enterprise data environment, normalisation is not a one-time database design task. It is an ongoing concern spanning ingestion, transformation and activation — touching every team that produces or consumes data. Data engineers design normalised schemas. Marketing analysts rely on normalised data to get accurate segment counts. Data scientists apply numerical normalisation before model training. The concept surfaces at every layer of a modern data stack, which is why understanding data normalisation techniques across both disciplines is essential for anyone working with customer or operational data.
What are the main data normalisation techniques?
Here are the main data normalisation techniques:
Relational normalisation: Normal forms
Relational normalisation techniques are organised into progressive stages called normal forms. Each form builds on the previous one and addresses a specific structural flaw.
- First Normal Form (1NF) requires that every column holds only atomic, indivisible values and that each row is unique. For example, a Phone Numbers column containing multiple comma-separated values violates 1NF. The fix is to split those values into separate rows or a related table.
- Second Normal Form (2NF) requires that every non-key column depend on the entire primary key, not just part of it. This eliminates partial dependencies that cause update anomalies in tables with composite keys. A classic case is an order-items table where the product description depends only on the product ID, not on the full composite key of order ID plus product ID. Moving the product description to a separate products table resolves the violation.
- Third Normal Form (3NF) requires that no non-key columns depend on other non-key columns, removing transitive dependencies. If a customer table shops both a Postcode and a city name and the city can be derived from the Postcode, a single update to the city name without updating the Postcode leaves the data in a contradictory state. Separating the ZIP-to-city mapping into its own table eliminates this risk.
- Boyce-Codd Normal Form (BCNF) is a strict variant of 3NF used when a table has multiple overlapping candidate keys. It is less commonly needed but resolves edge cases that 3NF does not cover.
Numerical normalisation: Scaling methods
Numerical normalisation techniques rescale numeric features so that differences in magnitude do not distort model outputs.
- Min-max scaling compresses all values into a fixed range, typically zero to one. It works well when the feature's distribution is known and bounded, such as age in a known population. But a single extreme outlier can compress the rest of the values into a narrow band, reducing the feature's discriminative power.
- Z-score standardisation transforms values, so the feature has a mean of zero and a standard deviation of one. It is preferred when the data contains outliers or when the algorithm assumes a normal distribution, such as logistic regression or principal component analysis. The trade-off is that the output values are no longer in the original units, which can make results harder to interpret for business stakeholders.
- Log scaling applies a logarithmic transformation to compress large value ranges. It is useful for revenue or page-view data that spans several orders of magnitude. It cannot be applied directly to zero or negative values without an adjustment, such as adding a constant before transformation.
- Clipping sets a hard upper or lower bound and caps values outside it, preventing extreme outliers from distorting a model without removing the row entirely. The risk is discarding a genuine signal if the threshold is set too aggressively.
Technique selection guide.
Why does data normalisation matter for data quality?
Unnormalised relational data produces three categories of anomalies that silently corrupt records.
- Update anomaly. The same fact is stored in multiple rows. Changing a customer's email address in one row but not others leaves the database in a contradictory state. A marketing team pulling email lists from this table will send messages to outdated addresses and deduplication logic will treat the same customer as two different people.
- Insertion anomaly. Adding a new record requires data that should not logically be required. For example, a schema that shops product information only within order rows makes it impossible to add a new product until a sale exists, delaying catalogue updates.
- Deletion anomaly. Removing a row inadvertently deletes unrelated information stored in the same row. Deleting the last order for a customer might also erase the customer's contact information if both are stored in a single table.
Each of these anomalies produces downstream reporting errors that are difficult to trace back to their structural cause because the data looks plausible at the row level, even when it is contradictory at the table level.
For machine learning pipelines, unnormalised numerical features cause a different class of problems. Distance-based algorithms such as k-nearest neighbours and gradient-descent-based optimisers treat a feature with values in the thousands as far more influential than a feature with values between zero and one, even if both carry equal predictive information. The business cost is a model that performs well on training data but degrades in production because feature scale, not feature signal, is driving predictions.
Data cleansing and data validation are closely related disciplines that work alongside normalisation. Cleansing removes or corrects inaccurate records. Validation confirms that incoming data conforms to expected formats and constraints before it enters a pipeline. Normalisation assumes the data is already clean and valid. Applying normalisation to dirty data produces a consistently structured mess rather than a reliable dataset. Teams that skip data cleansing techniques before normalising often discover the problem only when downstream reports show impossible values in neatly formatted columns.
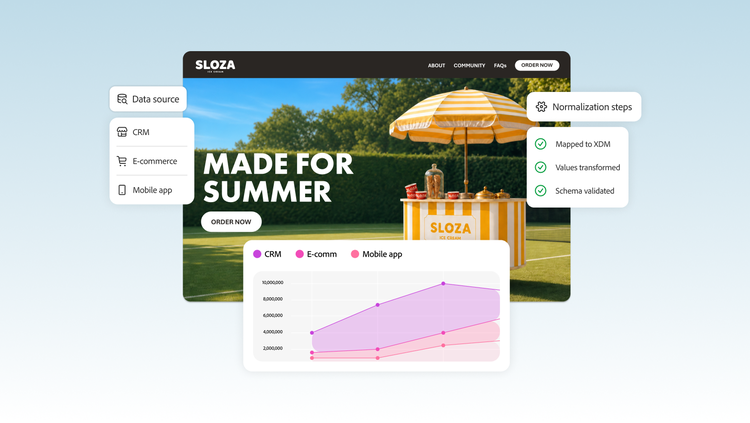
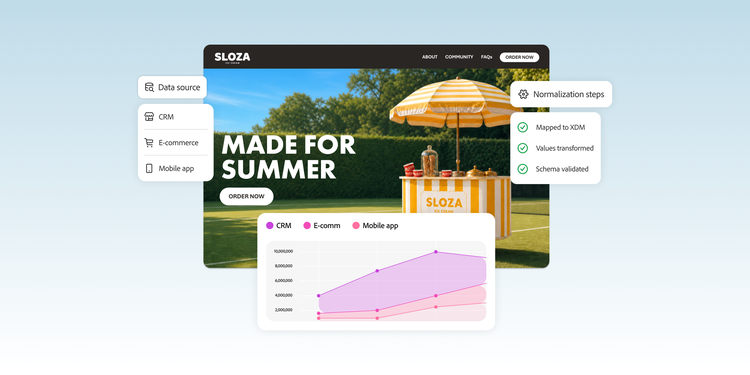
Organisations managing customer data across multiple channels face a compounded version of this problem. When a customer's attributes arrive from a CRM, an ecommerce platform, a mobile app and a support system, each source typically uses different field names, value formats and data types. Without normalisation at the ingestion layer, unified customer profiles become unreliable, producing duplicate records, missed segments and personalisation errors.
How does data normalisation fit into a broader data pipeline?
Normalisation sits at the data transformation stage of a standard extract-transform-load (ETL) or extract-load-transform (ELT) pipeline, after raw data has been ingested and before it is written to a destination system for analysis or activation. The sequence matters. Data transformation tasks such as format conversion and field mapping typically precede normalisation, while data enrichment, appending third-party attributes or derived signals, typically follow it. Enrichment is more reliable when applied to a clean, consistent base.
Data standardisation is a closely related but distinct step. Standardisation aligns values with a common vocabulary or format — for example, converting all date formats to ISO 8601 — or mapping country names to ISO 3166 codes. Normalisation then goes further by restructuring how data is organised across tables or rescaling numerical values. Confusing the two leads teams to apply the wrong fix — standardising field formats when the real problem is a poorly structured schema or normalising a table when the real problem is inconsistent value encoding. For a detailed comparison of data normalisation versus standardisation, the distinction is worth studying before committing to a pipeline design.
In practice, the boundary between these pipeline stages is fluid. A mature data team treats normalisation as part of a continuous data quality programme, not a schema design decision made once at project start. Every new data source added to a platform introduces normalisation decisions — how to map its fields to the existing schema, how to handle value conflicts and whether numerical features need rescaling before downstream use.
Data modelling provides the structural blueprint that normalisation works within. A well-designed data model defines which entities exist, how they relate and which normal form is appropriate for each table. These data modelling techniques determine how much normalisation work is needed and how complex the resulting query layer will be. Teams that skip the modelling step often find themselves re-normalising tables repeatedly as new requirements surface, which is why writing to a destination system for analysis or activation demands careful upfront planning.
How do you choose the right normalisation approach for your organisation?
The choice between relational and numerical normalisation is not mutually exclusive. Most enterprise data environments require both. The decision is about which technique to apply where and to what depth.
If your primary concern is database schema design for a transactional system, such as a CRM, order management platform or customer data store, prioritise relational normalisation to 3NF. This reduces storage costs, prevents update anomalies and makes the schema easier to maintain as requirements change. If query performance degrades because of the resulting join complexity, consider selective denormalisation of read-heavy tables rather than abandoning the normalised foundation.
If your primary concern is preparing data for machine learning models or statistical analysis, prioritise numerical normalisation. Choose min-max scaling when features have a known, bounded range and the algorithm does not assume a specific distribution. Choose Z-score standardisation when features may contain outliers or when the algorithm expects zero-mean input. Apply log scaling to any feature with a heavily right-skewed distribution before evaluating other options.
If your organisation manages customer data from multiple source systems, a scenario common in retail, financial services and digital media, the normalisation challenge is primarily about schema alignment and value consistency across sources. This is where a customer data platform that enforces a common data model at ingestion becomes operationally significant. Adobe Experience Platform addresses this use case by applying a standardised schema framework, the Experience Data Model (XDM), that normalises incoming data from disparate sources into a unified customer profile. This reduces the manual normalisation work that would otherwise fall to data engineering teams. Teams evaluating enterprise platforms should assess whether the platform enforces schema normalisation at ingestion or defers it to downstream consumers.
Before committing to a normalisation strategy, run through a practical evaluation checklist:
- Identify the primary consumers of the data. Reporting tools, machine learning (ML) models and activation systems each have different tolerances for join complexity and sensitivity to scale.
- Audit existing schemas for the three anomaly types — update, insertion and deletion — before designing a normalisation strategy. The anomalies present will indicate which normal form is needed.
- Profile numerical features for distribution shape and outlier density before selecting a scaling technique.
- Confirm that data cleansing and data validation steps are in place upstream. Normalisation applied to dirty data does not solve the underlying quality problem.
- Consider regulatory and privacy requirements. Data anonymisation techniques may need to be applied before or alongside normalisation, particularly when customer data from multiple sources is being merged into a unified profile.
Frequently asked questions.
What is the difference between data normalisation and data standardisation?
What are the three normal forms in database normalisation?
When should you not use database normalisation?
How does data normalisation affect machine learning model performance?
What is the difference between min-max scaling and Z-score normalisation?
Whether you are normalising relational schemas, rescaling numerical features or unifying customer data from dozens of source systems, the right platform can reduce months of manual data engineering to a governed, repeatable process. Learn how Adobe Experience Platform applies schema-level normalisation through the Experience Data Model to create unified customer profiles at enterprise scale at Adobe Experience Platform.
Recommended for you
https://business.adobe.com/fragments/resources/cards/thank-you-collections/rtcdp