
A cumulative flow diagram (CFD) is an analytical tool used in the Kanban method, an Agile project management system. It provides teams with a visualization of the workflow and overall project progress. CFDs help teams monitor workflow stability and better anticipate bottlenecks.
The flow graphic displays how work moves through your process. The horizontal axis (X-axis) displays the time, while the vertical axis (Y-axis) shows the number of work items. Each colored band on the graph corresponds to a specific stage in the workflow. These stages can include:
- To Do
- In Progress
- Done
Cumulative flow diagrams are widely used in software development. They’re also used in other industries, such as transportation, to analyze cycle time, manage work-in-progress (WIP) limits, and increase a team’s throughput.
What does a cumulative flow diagram show?
Cumulative flow diagrams visualize three key metrics. These are:
- Cycle time: This is your team’s total time to complete each task (from beginning to end). One of the benefits of CFDs is that it shows where you can optimize your workflow to reduce cycle times.
- Work in progress: This is the number of tasks your team actively handles at a particular time. Cumulative flow diagrams will visualize inefficiencies in your project timeline when your team has too much or too little work in progress at any given point.
- Throughput: This is the number of tasks your team can complete over a given period. As this is the ultimate measure of your team’s productivity, cumulative flow diagrams should show where you can align your efforts and resources so that throughput increases over time.
In this guide:
Benefits of using CFDs.
CFDs provide a better visualization of your workflow, which can help increase workflow efficiency and reduce bottlenecks. Here are some of the main advantages of using CFDs:
- Workflow visualization: Having a clear and concise view of your workflow can help you identify trends in the data and spot potential issues early, allowing you to adapt your workflow to avoid them.
- Communicating ideas: CFDs can be used to communicate ideas and workflows to stakeholders, helping them understand how a process works.
- Measuring process lead time and cycle time: CFDs can measure how long tasks take to move from one stage to another and identify where the process is too slow.
- Identifying bottlenecks: By clearly seeing the width of the bands in a CFD, teams can identify when a stage is slowing down, and work items are accumulating. This helps teams identify and address the root cause of bottlenecks.
- Accurate completion timelines: Analyzing the throughput line and observing the overall trend of the CFD can help your team to estimate project completion timelines accurately.
- Enhanced collaboration: The visualization can help to encourage better collaboration, as all team members can have a shared understanding of the work in progress and potential pitfalls.
- Data-driven decisions: CFDs can help you have focused discussions, where you can back up your decisions with data.
- Identifying problems: CFDs can reveal inconsistencies or inefficiencies in task completion. For example, a flow graphic can help pinpoint where the delay occurs if a task consistently takes longer than expected.
- Standardizing processes: CFDs can be used to standardize processes and ensure team efficiency and consistent high-quality output.
- Ensuring WIP levels are within capacity limits: CFDs can be used to monitor work-in-progress levels to ensure they are within capacity limits.
Key components of a cumulative flow diagram.
There are four key components of a cumulative flow diagram. These are the time (X-axis), work items (Y-axis), workflow states, and the throughput line. Here’s a little more about them and what role they play in the flow diagram:
- Time (X-axis): The X-axis highlights time in days, weeks, or sprints. This enables you to watch how the work unfolds, observe trends and patterns, and spot potential delays.
- Work items (Y-axis): The Y-axis records the cumulative number of work items, such as tasks. As a new item is added to the workflow, the graph rises to clearly visualize how the work is accumulating.
- Workflow states: Each stage in the workflow is represented by a color-coded band. The width of each band represents the number of work items or tasks in that stage. Wider bands can suggest potential bottlenecks and delays.
- Throughput line: Sometimes highlighted by the “Done” band, the throughput line highlights how quickly tasks are finished. A consistent upward slope indicates steady progress and a healthy workflow.
How to read a cumulative flow diagram.
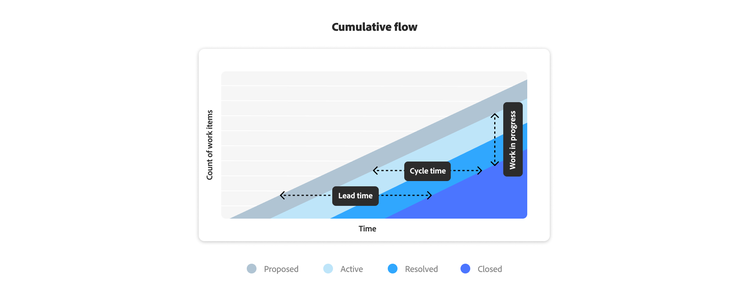
Cumulative flow diagrams chart the number of tasks in each stage of your workflow at any given period along the process timeline. Tasks are depicted along the vertical axis, while the horizontal axis shows the process timeline.
The differently colored bands represent the respective stages of your workflow as they appear on the Kanban board. The bands should give you an idea of how many tasks are at each stage of the process at any given time.
The top line of each band shows the point at which each task arrives at the respective stages of your Kanban board, while the bottom line shows when they leave. The distance between the two should be consistent with maintaining a steady workflow.
What to look out for in a cumulative flow diagram.
- Parallel bands indicate a steady workflow.
- Widening bands suggest bottlenecks.
- Narrowing bands highlight potential underutilization of resources.
- Downward slopes should not appear — this means there is an error.
The “Done” column is at the bottom of the graph, visualizing the work your team delivers in each period. The slope of the band between two points will show your team’s average throughput.
Creating a cumulative flow diagram.
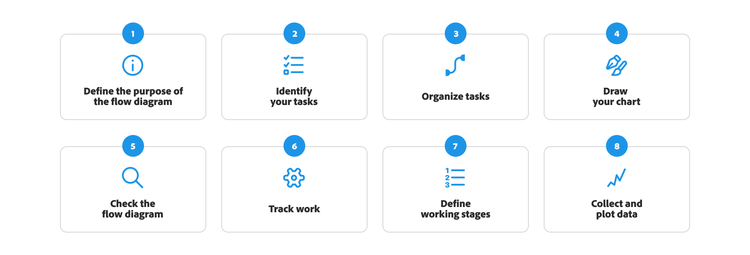
Creating a cumulative flow diagram doesn’t need to be complicated. Follow these steps to get started:
- Define the purpose of the flow diagram. Determine which process you’re analyzing in the CFD. What do you hope to accomplish?
- Identify your tasks. You need to identify your tasks in chronological order. You may need to observe the process and review documentation to understand all the steps involved.
- Organize tasks. Use flow chart symbols to label functions in the correct shape — for example, diamonds for decisions and arrows to show the flow of work.
- Draw your chart. You could do this by hand or use a digital tool like Adobe Workfront.
- Check the flow diagram. Walk through the steps with people who regularly participate in the process to ensure its accuracy.
- Track work: Use a project management tool to track all work items, like tasks, user stories, or bugs.
- Define workflow stages: Clearly define the stages that work items go through in your workflow, such as “To do,” “In progress,” “Review,” and “Done.”
- Collect and plot data: Regularly collect data to plot the cumulative flow of work items in each stage over time.
Cumulative flow diagrams in Agile methodologies.
CFDs are increasingly being used to visualize and manage workflow across multiple teams and projects in Agile frameworks — like Kanban, SAFe and LeSS.Cumulative flow diagrams and burndown charts are both used in Agile development, but they serve different purposes. CFDs track the progress of tasks through different stages, while burndown charts track the completion of tasks over time.
Advanced CFD analysis.
In addition to its basic functions, a CFD can be used for more in-depth analysis. Here are some of its more advanced uses:
- Measuring cycle-time efficiency: By analyzing the horizontal distance between the start and end points of a work item on the CFD, you can predict its cycle time. If the cycle time for a particular type of task is consistently long, you can investigate the reasons for this and the value of the task, and work towards streamlining the process.
- Predicting future performance: By analyzing data and trends in the flow graphic, you can predict future performance. This allows teams to make informed decisions about resource allocation, risk mitigation, and project planning.
Types of cumulative flow charts.
CFDs can also be categorized into different types of flowcharts, each with a specific focus. For example:
- Document flowcharts: These illustrate the flow of documents through a system.
- Data flowcharts: These show the flow of data within a system.
- System flowcharts: These depict the flow of data through major components of a system.
- Program flowcharts: These illustrate the control flow within a program.
Other related diagrams that are sometimes considered types of flowcharts include:
- Data flow diagram (DFD): This displays the flow of information for any system or process.
- Process flow diagram (PFD): This shows the relationships between major components in an industrial plant.
- Business process model and notation (BPMN 2.0): This is used to model the steps of a planned business process.
When CFDs are used correctly, you should be able to identify the stability of your workflow and any problem areas to address. Correct analysis and monitoring of your cumulative flow diagram will tell you which areas need your attention to maintain continuous process improvement. As such, cumulative flow graphics provide you with the tools to improve the overall productivity and efficiency of your team and projects.
Get started with cumulative flow diagram tools.
There are multiple tools that can help you produce and manage cumulative flow diagrams. These include project management software with built-in CFD functionality, like Workfront. Specialized CFD tools also focus specifically on creating and analyzing CFDs.
When deciding on what tool to use, consider these factors:
- Team size
- Integration capabilities
- Ease of use
Adobe Workfront is a cloud-based work management solution that helps your team plan, track, and manage resources. It supports multiple, including Agile. Workfront centralizes project management and streamlines tasks across departments.
Recommended for you
https://business.adobe.com/fragments/resources/cards/thank-you-collections/workfront
