Core web vitals are standardized metrics that quantify the user experience of a website based on a set of factors Google considers necessary. Introduced in 2020, Google’s Core Web Vitals consist of three specific measurements related to page speed and user interaction:
- Largest Contentful Paint (LCP)
- Interaction to Next Paint (INP)
- Cumulative Layout Shift (CLS)
Core Web Vitals are metrics that measure user experience for loading performance, interactivity, and visual stability of webpages. Let’s take a closer look at them now.
In this guide:
Largest Contentful Paint (LCP)

Largest Contentful Paint represents how quickly a web page's main content becomes visible after it starts loading. Specifically, LCP measures the time the page renders its largest content. The largest visible element may be a video, rich imagery, or a text block.
A website with an LCP time below 2.5 seconds receives a “Good” rating. A time between 2.5 and 4 seconds is rated as “Needs Improvement,” while an LCP time greater than or equal to 4 seconds is a “Poor” score. There are many ways to improve the loading speed of a webpage, typically through deleting unnecessary code or minimizing the amount of data you’re trying to load.
You may need to employ several approaches before you get the desired results, as you’ll need to tailor your approach to your page. Some common ways of reducing your LCP time include:
- Removing unused CSS: Cascading Style Sheets, or CSS, tell a browser what a website should look like. Sometimes, CSS data is attached to a page but not used, typically because the earlier data is overwritten. Tools such as Chrome DevTools can find unused CSS rules that can be removed.
- Defer non-critical CSS: Not everything on the page must be loaded simultaneously. If you can delay the non-critical CSS content, you can create a page that loads the essentials first while the rest loads in the background.
- Minify and compress CSS: Even critical styles that can’t be deferred can be improved by reducing their size. Minification removes unnecessary characters and spaces without changing the way your browser reads them.

Interaction to Next Paint (INP)
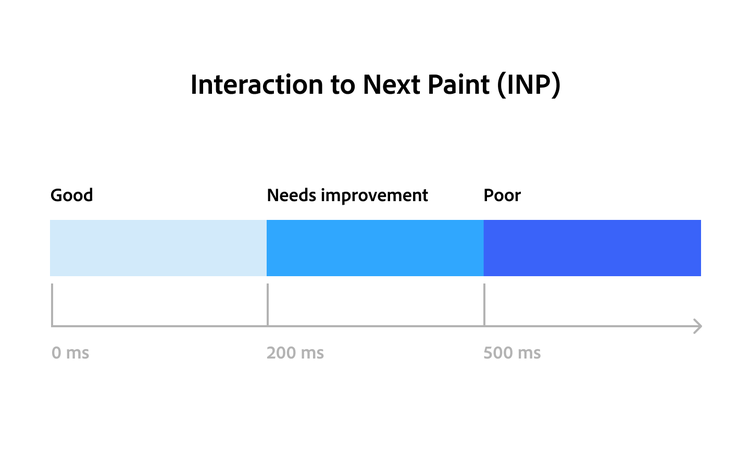
Interaction to Next Paint (INP) measures the responsiveness of a webpage. Whether it’s a click, keyboard, or finger tap, INP takes an inventory of every interaction and measures the one that results in the longest response. For example, if a page responds almost instantly when you scroll but takes half a second to register typing on a keyboard, that half second will be used for the INP score.
Some functions will take longer than others, even when prioritizing a fast response time. To even things out, it’s best to measure the 75th percentile of interaction times. An INP of 200 milliseconds or below is considered good. Somewhere between 200 and 500 milliseconds means the page needs improvement, and an INP over 500 milliseconds is considered poor.
Ways to improve your INP score include:
- Yield to the main thread – Browsers continuously run tasks, a process often referred to as the main thread. Yielding to the main thread refers to pausing these tasks to prioritize a user’s interactions.
- Reduce unnecessary code—JavaScript can consume a lot of data. Reducing or removing unnecessary data can decrease the time it takes to load your site and increase responsiveness.
Cumulative Layout Shift (CLS)

Cumulative Layout Shift (CLS) evaluates the user experience based on the perceived visual stability of a page load. As a page loads, CLS measures the unexpected layout shifts or how much content moves around.
For example, a poor CLS score would result if a site visitor was reading a page, a banner loaded, and the page suddenly jumped. In some instances, this can cause users to inadvertently click a banner ad and be directed off the page they intended to visit, causing user frustration. Pages should aim to have a CLS of 0.1 or less.
Ways to improve your CLS include:
- Set sizes on your content—One of the primary causes of layout shift is content moving after another piece of content has loaded. To avoid this, you can reserve the space you need in advance. Setting the width and height of a CSS property explicitly can prepare a browser for your content before it loads.
- Reduce animations and transitions on your page—Animated elements are a common source of layout shift. A good rule of thumb is to avoid animations or transitions that update the layout of your page.
Why Core Web Vitals Matter?
Largest contentful paint, interaction to next paint, and cumulative layout shift are important to deliver a better user experience. Good core web vitals can prevent users from getting frustrated and bouncing from your site.
Conversely, neglecting your core web vitals can result in a negative user experience, reducing conversions as visitors bounce off your page and go to a competitor. Poor core web vitals may also decrease keyword ranking visibility and push your site down on search engine results pages (SERP).
Measuring Core Web Vitals
Several ways to effectively measure your site’s core web vitals can vary based on your business needs, goals, and resources. Some options to consider include:
- Google Search Console’s Core Web Vitals report. Google’s report shows how your pages perform based on field data and helps you fix poor user experiences on your site. Using the three Core Web Vitals metrics as measured by actual user data, the report displays URL performance grouped by status (Poor, Needs improvement, or Good), metric type (CLS, FID, LCP), and URL group (groups of similar web pages).
- Chrome User Experience Report. The Chrome User Experience Report (CrUX) provides metrics and produces data that reflect how real-world Chrome users experience popular destinations on the internet. The data collected by Chrome is available publicly through a number of tools and is used by Google Search to inform the page experience ranking factor.
- Inspect Element. Right-clicking on a page, navigating to “sources,” and hitting control + shift + p will give you a high-level overview of core web vitals metrics.
- Web-vitals JavaScript library. Another method to measure each of the Core Web Vitals is to use the JavaScript library, which evaluates the metrics to match how the Google tools report them. This can be done by running a simple script on your web pages.
- Web Vitals Chrome extension. This extension measures the Core Web Vitals, providing instant feedback on loading, interactivity, and layout shift metrics. It’s consistent with how Chrome measures these metrics and reports them to other Google tools.
- PageSpeed Insights (PSI). PSI is a simple tool that provides a snapshot overview of an individual page. It can only provide data on public pages but can display data for your competitors or similar sites.
While it’s possible to test these metrics in a controlled, lab-like environment, focus on measuring how actual visitors interact with your website to acquire data that can help you improve the true user experience.
CrUX supplementary metrics
It’s also worth noting that there are additional performance metrics besides the core web vitals. Standard options to monitor include:
- Time to First Byte: TTFB tracks the responsiveness of the web server. Specifically, it times the length between the user’s HTTP request and the first byte to arrive at the client’s browser. Anything less than 200 milliseconds is considered a good TTFB speed.
- First Contentful Paint: FCP measures the time the first content appears on screen after a page begins loading. Anything under 1.8 seconds is considered good.
- Time to Interactive: TTI tracks how long it takes for a page to become fully interactive. You should aim for a TTI score under 3.8 seconds.
- Total Blocking Time (TBT): TBT measures a page's responsiveness, specifically the time between TTI and FCP. If you want a good TBT, you should aim for a target under 300 milliseconds, but ultimately, the lower the score, the better.
Understanding how Core Web Vitals inform and impact your site’s user experience will help you create a better experience for visitors and ensure your content gets the attention it deserves. If you want to take the next step, load up your site and experience it from the user's point of view. That way, you can identify any obvious areas of improvement.
But even a fast, responsive, and visually stable website doesn’t do you much good without great content and personalization that meet the modern customer’s high expectations. Adobe Experience Manager Assets automates content and supports various file types, giving you everything you need to optimize your site and create a seamless user experience.
Watch an overview video to learn how Experience Manager Assets can help you optimize your website’s content.
Recommended for you
https://business.adobe.com/fragments/resources/cards/thank-you-collections/experience-manager-assets