Adobe Customer Journey Analytics B2B Edition Features
B2B account-level analysis
Boost performance across marketing, sales, and product teams with analysis and journey visualization tools built for the complexities of B2B journeys.
Book a demo | Book a demo Customer Journey Analytics B2B Edition Try for free | Try for free Customer Journey Analytics B2B Edition Sandbox
Templates and tailored reports
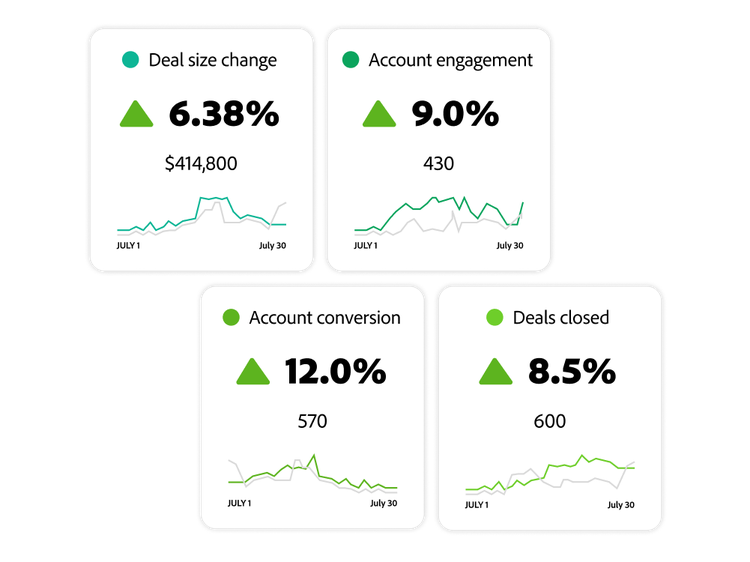
Quickly identify what's working and what's not with pre-built templates for in-depth journey analysis and reporting that leverages account and opportunity data frameworks.
- Growth metrics and trends. Track metrics and trends over time, including changes in accounts, buying groups, opportunities, and average deal size.
- Engagement. Monitor engagement and initiate early intervention for accounts at risk of churn or downsell.
- Fallout. Analyze conversion and drop-off points across the sales pipeline to pinpoint optimization areas.
- Marketing life cycle analysis. Understand how marketing channels, content, and campaigns generate new opportunities and contribute to closed deals.
Journey canvas
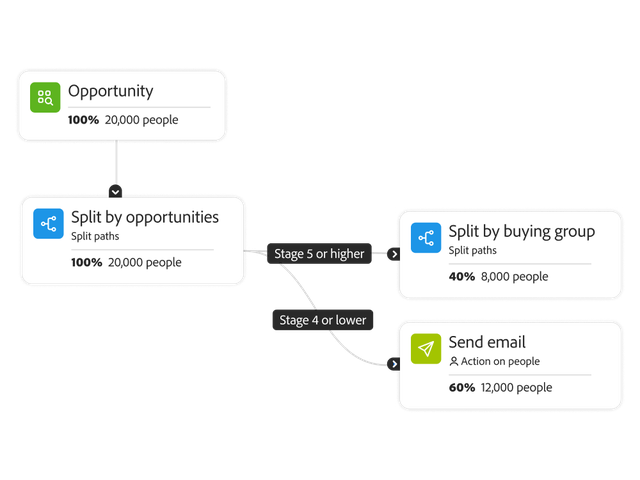
Tap into a powerful, intuitive journey canvas to visually map and analyze account, opportunity, and buying group journeys.
- Comprehensive journeys. Track the progression of opportunities in an interactive dashboard — from initial visitor to closed-won deal.
- Cross-channel experiences. Visualize all account engagement across marketing, sales, and customer support.
- Journey stages. Add visual nodes to the journey canvas to mark critical touchpoints and chart key metrics.
Guided analysis
Analyze the factors driving product performance, growth and engagement, as well as the impact of new releases. Give your teams the ability to self-serve insights on buying group, account, and opportunity journeys using guided workflows.
- Active growth analysis. Get insights into product user growth and acquisition over a defined period.
- Release impact analysis. Compare the performance of key indicators — such as a product update or campaign launch — before and after a specific date.
- Engagement analysis. Understand the frequency of product feature use compared to the number of users.


Analysis workspace
Give teams a simple-to-use, drag-and-drop canvas to perform fast, complex group-level analyses across multiple data sets and sources without the need to write SQL.
- Accessible insights. Build reusable projects customized to your unique questions while blending different views of data to tell a powerful data-driven story.
- Robust toolkit. Leverage multiple tools to query and draw insights from your data, including free-form tables, cohorts, segmentation, attribution, visualizations, and context labeling.
- Total population. Identify and analyze which individuals and accounts aren’t engaging across your total population of IDs — so you can answer questions like, “What percentage of my customer base was digitally active last week,” or “How many accounts have opportunities but no sales contact this month?”
Algorithmic attribution
Leverage fully integrated enterprise attribution with journey analytics. Compare activity across devices, channels, and content to understand the drivers responsible for specific conversion events — across any time period and metric.
- Data-driven attribution. Use machine learning to assign attribution values across various contributing factors and channels of successful conversion events.
- Weighted attribution. Automatically assign appropriate attribution weight to the most important touches and provide a best-fit model per channel based on your buyers' actual interaction patterns.

Learn how to use account-level analysis features.
Find what you need in Adobe Experience League, our vast collection of how-to content — including documentation, tutorials, and user guides.
Learn more | Learn how to use analysis visualization features
