Using generative AI in Adobe Content Analytics to understand your digital performance.
03-18-2025

In the early days of the web, Bill Gates wrote, “Content is King,” predicting the importance of content for online business success. High-quality, personalised content that solves customer problems has indeed become essential. However, the flood of content has made companies lose focus on customer needs. Brands have struggled to measure creative content and gain quick insights to optimise content in real time. Now they are using generative AI to assist in this process.
According to eMarketer, 80% of CMOs have reported that AI has improved productivity, with 30% of CMOs prioritising insight generation and 27% prioritising predictive analytics. This is important now that personalisation is just a starting point for businesses. They need to be able to understand not only what message is resonating with users but also what image is affecting that user’s engagement, time on site and purchases.
When a brand can measure content engagement on their website, they can make better decisions about which content to serve when and where it can keep users most engaged. Better measurement allows brands to see what content is delivering results, so they can invest more in that type of content — or retire images that are stagnant and boring.
Common content challenges:
- Disjointed tech stacks that collect data in silos with limited budget to make changes
- No visibility into how content is performing and the direct impact it has on revenue
- Lack of a self-serve model for immediate content performance insights
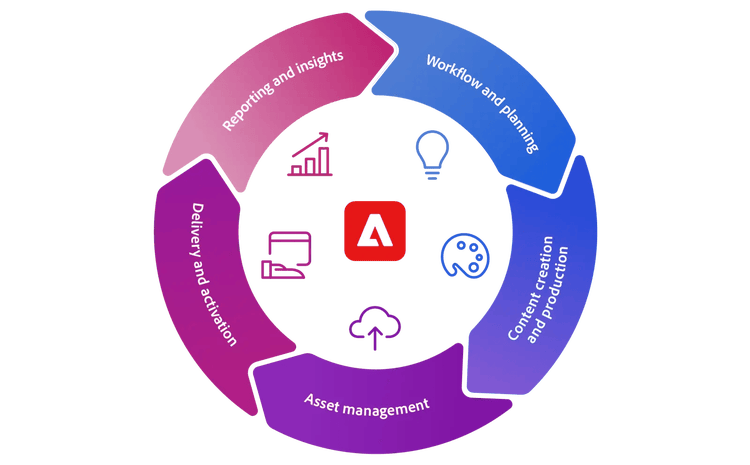
Within the content supply chain, Adobe is helping businesses address challenges in workflow and planning, content creation, asset management, delivery and activation and reporting and insights. The reporting and insights pillar allow brands to truly realise how well their content is engaging new and existing customers — to inform current optimisation strategies and future campaign planning. With new performance engagement reports, brands can see how their content investments are performing in near real-time and why insights are such a vital aspect of the content supply chain workflow in Adobe GenStudio.
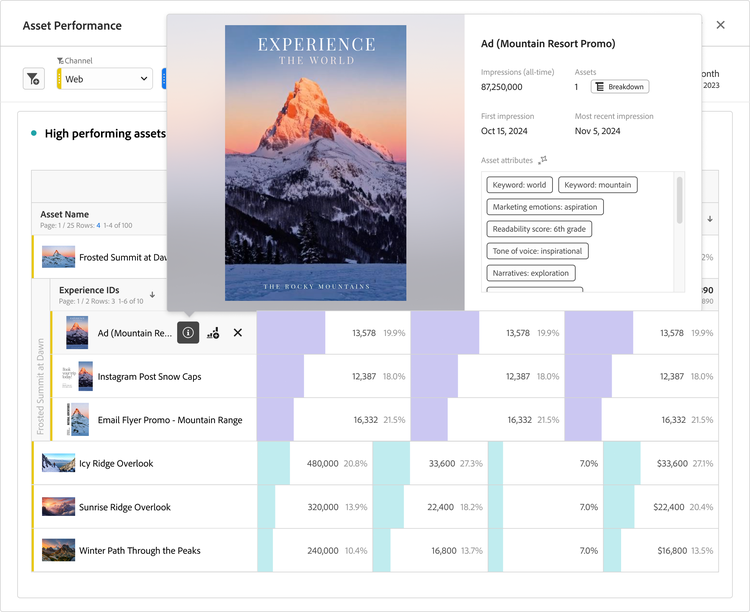
With Adobe Content Analytics, brands will be able to bring content and data together to measure performance — starting with website images and later other channels like paid media and email. Content performance data will provide new vital KPI metrics like image impressions, clicks and click-through rates, to determine which placements or content types are performing best. The real magic of Content Analytics is the generative AI component that scans images and auto-populates attributes about the image, without the need to manually tag each asset. The attributes can be used in reporting as new dimensions to compare how images perform based on colour, tone, imagery, scenes, people, emotions, photography style, persuasion strategy and more.
Here are some of the many benefits that Content Analytics provides:
- Understand experiences by extracting and organising content with AI and machine learning to more easily gauge performance by location and delivery.
- Uncover and share content results to all teams that have a hand in the creative process, to optimise creative more effectively.
- Tie content performance to user behaviours to understand the true impact of your content and how it drives conversions.
- Measure trending assets or attributes and monitor for signs of creative fatigue and disinterest to optimise performance.
- Align content performance with audiences to create new segments to target based on content views.
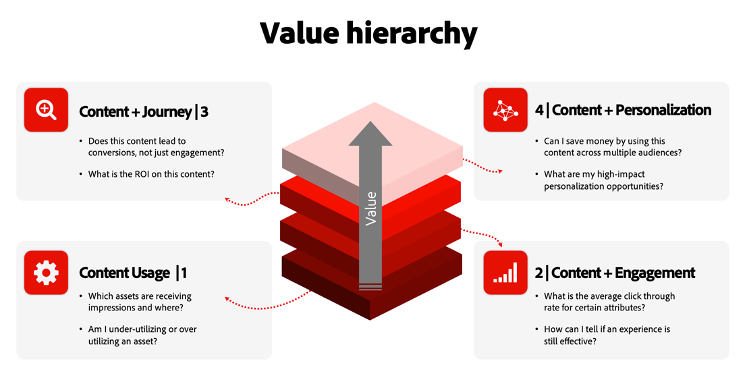
As brands start to use Content Analytics, they’ll be able to go from measuring general content engagement, to understanding how many views an image has, to knowing what types of personalised images are making an impact and leading to conversions — segmented by audience. With Content Analytics, you’ll unlock new insights about how your website shop front is making an impact on your customers and business goals, before those insights become stale and unactionable.
Learn more about Adobe Content Analytics and how it can elevate your digital analytics here.
Recommended reading:
- https://business.adobe.com/blog/the-latest/boost-campaign-performance-with-content-analytics
- https://business.adobe.com/blog/how-to/create-a-content-supply-chain-that-will-stand-the-test-of-time
Sanjay Vachani is a senior director of product marketing within the Digital Experience business at Adobe. Vachani is responsible for GTM strategy and product marketing for Adobe’s Data and Insights business, which includes Adobe Analytics, Customer Journey Analytics and Content Analytics — all industry-leading solutions powering brands’ data-driven customer experience management decisions with scale and personalisation. He has been with Adobe since 2016, holding roles across business strategy, GTM strategy, business development and product marketing. Prior to joining Adobe, Vachani was a consultant at McKinsey & Company, advising clients across a variety of industries on their growth, marketing and customer experience strategies. Sanjay holds a bachelor’s degree in applied economics and management from Cornell University and an MBA from the University of Michigan’s Ross School of Business.
