What marketing metrics matter in 2025? See what over 400 marketers said.
09-16-2025

Marketing teams are under increasing pressure to prove their impact — but what counts as “results” is shifting. Traditional performance indicators are being re-evaluated as businesses prioritise long-term value, cross-channel insights and metrics that align with evolving buyer behaviours.
To understand how marketers are navigating this shift, Adobe for Business surveyed over 400 U.S. marketing professionals across roles, industries and company sizes. The findings reveal not just which metrics matter in 2025, but how reporting structures, stakeholder expectations and tool adoption are shaping what gets measured — and why.
Key findings.
- Brand awareness metrics — including mentions, sentiment and branded search — rank as the most valuable in 2025.
- Yet only 1 in 10 marketers have access to real-time brand data.
- ROI is named the top metric by nearly 1 in 5 marketers, but just 34% track it consistently.
- Social media follower growth is the metric expected to lose the most value — especially among enterprise teams.
- On average, marketers spend over 20 hours annually producing reports that stakeholders don’t engage with.
- 73% of marketers say clients request weekly ad hoc reports, widening the gap between effort and impact.
Why marketing analytics matters more in 2025.
Marketing analytics enables teams to move beyond guesswork and tie performance to outcomes. With the right tools and techniques, teams can understand what works, prove ROI and improve the customer journey across every touchpoint.
For mid-market to enterprise organisations in sectors like retail, technology and financial services, analytics helps simplify complex journeys, optimise resource allocation and align marketing activity with revenue goals.
This post will cover:
- What is marketing analytics?
- What can marketing analytics evaluate?
- Beyond ROI: Marketers are refocusing on brand and engagement
- Engagement and content metrics are gaining traction
- ROI remains critical — but undermeasured
- Role-based metrics: Why context matters
- Metrics falling out of favour in 2025
- Making customer lifetime value (CLV) actionable with Adobe Real-Time CDP and Adobe Customer Journey Analytics
- Components of an effective marketing analytics strategy
- Practical analytics techniques marketers are using
- How marketing analytics is used in the real world
- Why reporting still feels broken
- What stakeholders want from reports
- Five measurement methods to assess marketing performance
- Getting started with marketing analytics
- How Adobe Customer Journey Analytics helps
What is marketing analytics?
Marketing analytics is the practice of collecting, analysing and interpreting marketing data to measure performance and understand customer behaviour. It combines tools and techniques that allow marketers to move from reporting what happened to understanding why — and what to do next.
What can marketing analytics evaluate?
Analytics gives teams visibility into both tactical performance and strategic impact. Common areas of evaluation include:
- Calls-to-action (CTAs): Identify which messages drive the most clicks and conversions.
- Site content engagement: Track how visitors interact with pages, videos and downloads.
- Channel performance: Compare how each channel contributes to lead quality and customer acquisition.
- Thought leadership performance: Measure which topics resonate with key decision-makers.
- Website user experience: Detect friction points that may be hurting conversion rates.
Beyond ROI: Marketers are refocusing on brand and engagement.
In 2025, the spotlight is shifting. While ROI remains essential, marketers are placing increased value on metrics that reflect brand presence and audience perception.
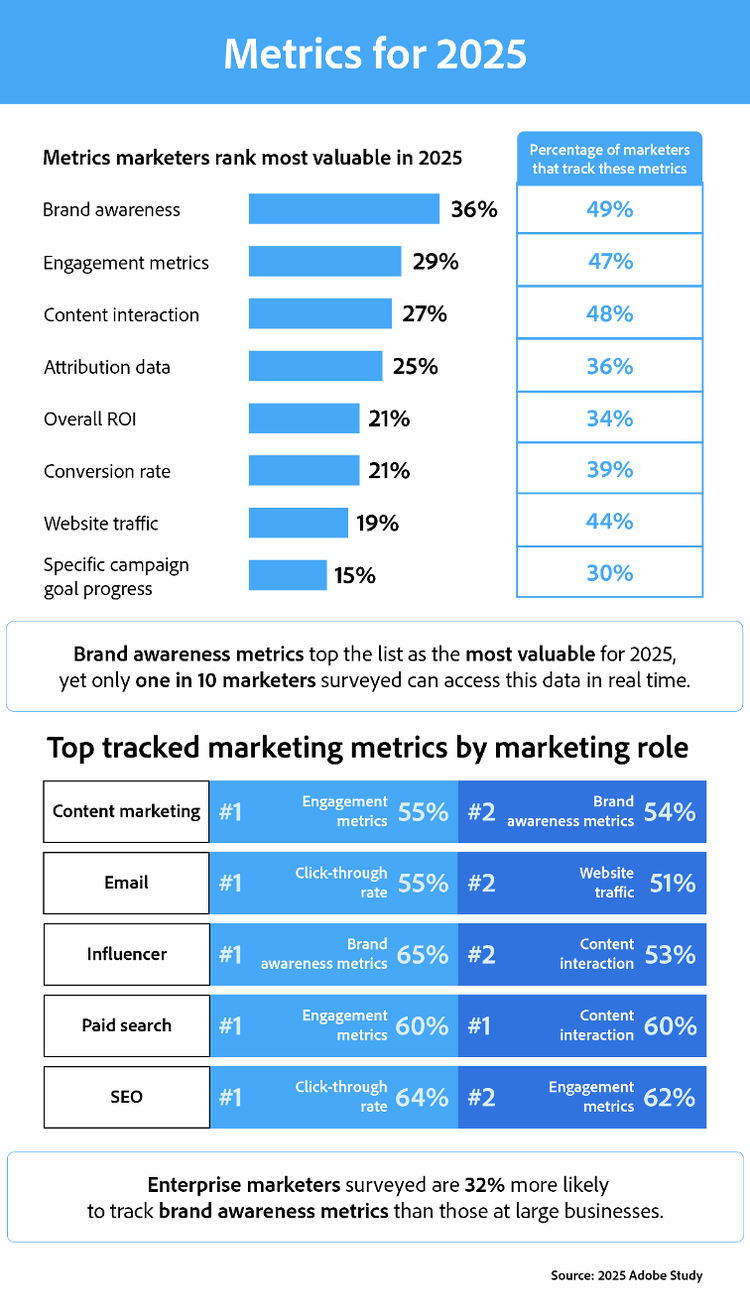
Over one-third of marketers surveyed identified brand awareness as their most valuable metric category.
This includes metrics like:
- Branded search volume
- Direct traffic
- Social media mentions
- Share of voice
- Brand sentiment
Yet less than half of marketers are actively tracking these indicators — and only 10% have real-time access. Without visibility into brand perception, marketing efforts risk misalignment with audience expectations.
Engagement and content metrics are gaining traction.
Second only to brand, engagement metrics like time on site, click-through rate (CTR), bounce rate, scroll depth and repeat visits are increasingly prioritised.
- 29% of marketers cited engagement as their most valuable performance category.
- 27% ranked content interaction close behind.
- But 10% have never tracked engagement at all, highlighting a gap between intent and execution.
As marketers shift focus from vanity metrics to behavioural signals, tools like Adobe Customer Journey Analytics are enabling teams to turn fragmented data into cohesive customer stories — so that engagement can be tied to affect, not just activity.
ROI remains critical — but undermeasured.
Nearly one in five marketers called ROI their top priority metric. But only 34% track it consistently. The reason? Disconnected tools and channels make attribution difficult — and performance timelines often vary across campaigns.
Adobe’s analytics solutions help close this gap. By integrating cross-channel data into a unified view, teams can finally track ROI in context — revealing what’s working, where budget should shift and how marketing drives revenue.
Role-based metrics: Why context matters.
Different marketing roles prioritise different KPIs:
- Influencer marketers focus heavily on brand awareness.
- SEO and email marketers lean toward CTR and conversion metrics.
These variations reflect how each role defines success — but also reveal blind spots. Adobe Customer Journey Analytics bridges these silos by combining behavioural data across the funnel. With a complete view of the customer lifecycle, teams can collaborate around shared goals rather than isolated KPIs.
Metrics falling out of favour in 2025.
Some long-standing metrics are losing relevance — either because they fail to capture impact or are too difficult to measure effectively.
- Social media follower growth is expected to decline in value, especially among enterprise marketers.
- Customer lifetime value (CLV) is seen as too complex or fragmented to track — 37% of marketers don’t measure it at all and 15% say it’s losing relevance.
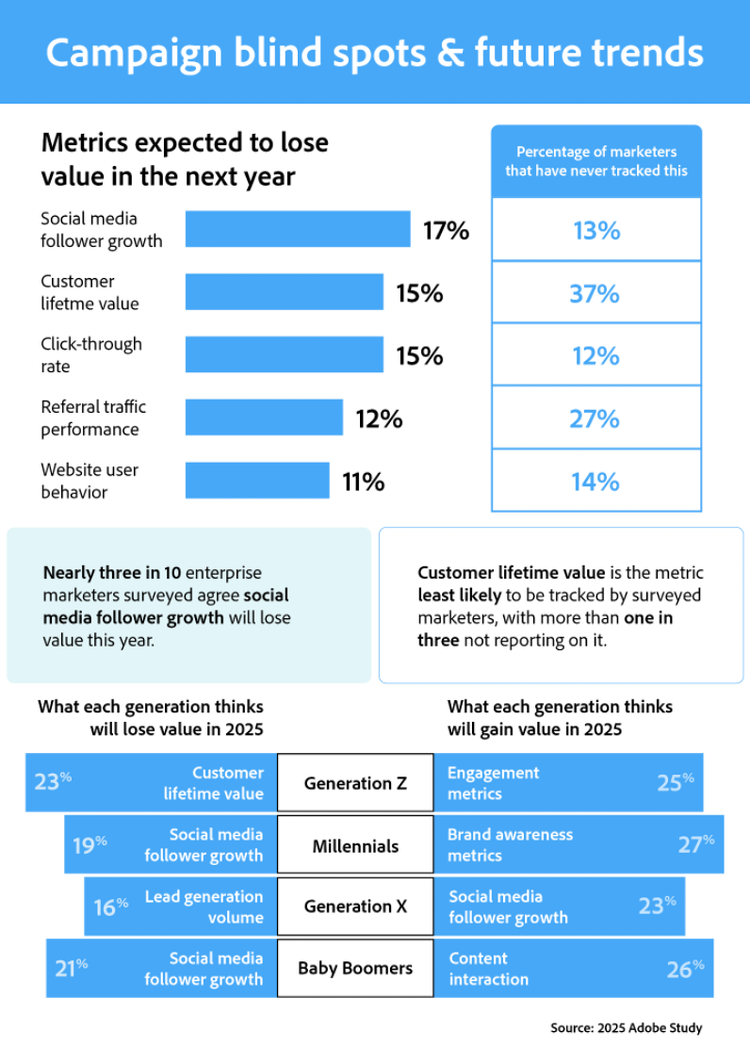
Yet CLV remains one of the most powerful indicators of long-term business health. The challenge isn’t its importance — it’s the infrastructure required to measure it.
Making CLV actionable with Adobe Real-Time CDP and Adobe Customer Journey Analytics.
Adobe Real-Time CDP unifies customer data into continuously updated profiles. When combined with Adobe Customer Journey Analytics, marketers can model long-term value and incorporate CLV into strategic planning.
Instead of treating CLV as a manual reporting burden, teams can shift from gut feeling to data-backed decisions — optimising budgets for lifetime impact, not just short-term wins.
Components of an effective marketing analytics strategy.
To implement effective marketing analytics, businesses rely on five essential components. Together, these elements enable teams to capture, analyse and act on marketing data to improve performance.
1. Centralised marketing database.
A centralised marketing database serves as the single source of truth for all campaign and customer data. By consolidating this information, marketers gain a unified view of audience engagement, campaign performance and cost metrics.
Why it matters: Without a centralised repository, data silos can obscure insights, leading to inefficient decision-making and resource allocation.
Example: A global B2B manufacturing firm consolidates customer engagement data from paid LinkedIn ads, email campaigns, trade show leads and website interactions into a single database. By unifying this information, the company gains visibility into the entire buyer journey, helping it to identify the most impactful touchpoints for conversions.
2. Time series analytics.
Time series analytics analyses data points collected over regular intervals to identify trends, seasonal patterns and long-term growth opportunities. This approach allows marketers to anticipate customer behaviour and plan campaigns accordingly.
Why it matters: Static, point-in-time snapshots fail to capture meaningful trends. Time series analytics reveals insights that can drive proactive decisions, like seasonal inventory planning or campaign adjustments.
Example: The same B2B manufacturing firm tracks quarterly trends in lead generation and sales, identifying consistent spikes during industry trade show seasons. Using these insights, the marketing team aligns content launches, ad campaigns and follow-ups to capitalise on high-demand periods, improving lead conversion rates.
3. Advanced attribution.
Advanced attribution models — such as multi-touch or data-driven attribution — assign value to all touchpoints in a customer’s journey, not just the first or last interaction. This ensures marketers understand how channels work together to drive conversions.
Why it matters: Simple attribution models can overlook critical interactions, leading to inaccurate ROI analysis and wasted ad spend. Advanced attribution highlights which campaigns and channels deliver the most value.
Example: A B2B manufacturing firm applies advanced attribution to analyse its sales pipeline, revealing that leads generated from LinkedIn ads often convert after engaging with a follow-up webinar and a targeted email campaign. By understanding the contribution of each touchpoint, the company refines its budget allocation to prioritise the highest-performing channels.
4. User-friendly dashboards.
User-friendly dashboards visualise key data trends and insights in an accessible format, enabling marketers to monitor performance at a glance. Designed for non-technical users, these dashboards can be built and customised independently — without relying on data teams — so marketers can track the metrics that matter the most, when they matter. By simplifying analytics access, they support faster, more informed decision-making across the organisation.
Why it matters: Most marketers aren’t data scientists. Intuitive dashboards bridge the gap, allowing teams to access insights without relying on complex tools or technical expertise.
Example: A B2B manufacturing firm uses real-time dashboards to track the performance of its global campaigns. The team quickly identifies a decline in engagement from mid-sized accounts and pivots messaging to emphasise cost-efficiency and ROI, resulting in a 15% improvement in mid-market lead conversions.
5. Ad Hoc reporting.
Ad Hoc reporting gives analysts the flexibility to generate customised, detailed reports based on specific queries or campaigns. It allows for deeper exploration of data beyond pre-built reports.
Why it matters: While dashboards provide high-level insights, ad hoc reporting uncovers granular details that inform strategy tweaks and uncover hidden opportunities.
Example: To improve its recent product launch campaign, a B2B manufacturing firm uses ad hoc reporting to analyse LinkedIn engagement metrics by region and job title. The findings reveal that procurement managers in Europe are highly engaged, prompting the team to double down on region-specific messaging and webinars.
Practical analytics techniques marketers are using.
Here are five techniques used by data-savvy marketing teams to go beyond reporting and into prediction:
1. Regression analysis.
Regression analysis identifies relationships between dependant and independent variables, helping marketers predict future outcomes based on historical trends.
Business impact: Quantifies the ROI of campaigns and enables confident budget allocation.
Example:
A B2B tech firm applies regression analysis to identify how increased LinkedIn ads expenditure correlates with sales-qualified lead (SQL) volume. These insights enable the team to optimise budget allocation — boosting SQLs by 15% without overspending
2. Cohort analysis.
Cohort analysis groups customers based on shared characteristics — such as acquisition date or purchase history — to identify trends over time.
Business impact: Improves retention strategies and identifies the long-term value of acquisition campaigns.
Example: A SaaS provider segments customers acquired through trade show promotions and organic search to compare retention rates. They find that event-driven cohorts deliver higher lifetime value.
3. Time series analysis.
Time series analysis evaluates data points collected at regular intervals to uncover trends, seasonality and growth opportunities.
Business impact: Allows businesses to anticipate demand and align campaigns with customer behaviour.
Example: A global manufacturer identifies seasonal demand spikes for industrial equipment and schedules ad campaigns and follow-ups to coincide with these periods, increasing conversions by 20%.
4. Factor analysis.
Factor analysis reduces large datasets into variables or factors that represent underlying drivers of behaviour.
Business impact: Simplifies decision-making by focusing on key influences.
Example: A financial services firm identifies customer satisfaction as the primary factor driving renewals. To increase retention rates, they improve support quality.
5. Monte Carlo simulations.
Monte Carlo simulations use probability modelling to predict outcomes under uncertain conditions.
Business impact: Helps marketers account for uncertainty in campaign outcomes by modelling a range of performance scenarios — such as budget allocation, conversion probabilities or channel mix — to support more confident, data-informed planning.
Example: A B2B tech company uses Monte Carlo simulations to predict how fluctuations in paid media performance — like varying CPCs and click-through rates — could affect lead volume and pipeline contribution. By simulating thousands of possible outcomes, the marketing team can forecast risk, stress-test budget plans and allocate spend more confidently across channels.
How marketing analytics is used in the real world.
Real examples from the field:
- A SaaS company uses cohort analysis to identify that customers acquired via webinars retain longer than those from paid search.
- A manufacturing brand leverages time series analytics to align campaigns with seasonal buying patterns, increasing conversion rates by 20%.
- A tech firm combines Adobe Real-Time CDP and Adobe Customer Journey Analytics to unify engagement data, making CLV a core metric in quarterly budget planning.
- A financial services provider uses regression analysis to determine how LinkedIn ads expenditure correlates with SQL volume — and reallocates funds accordingly.
Why reporting still feels broken.
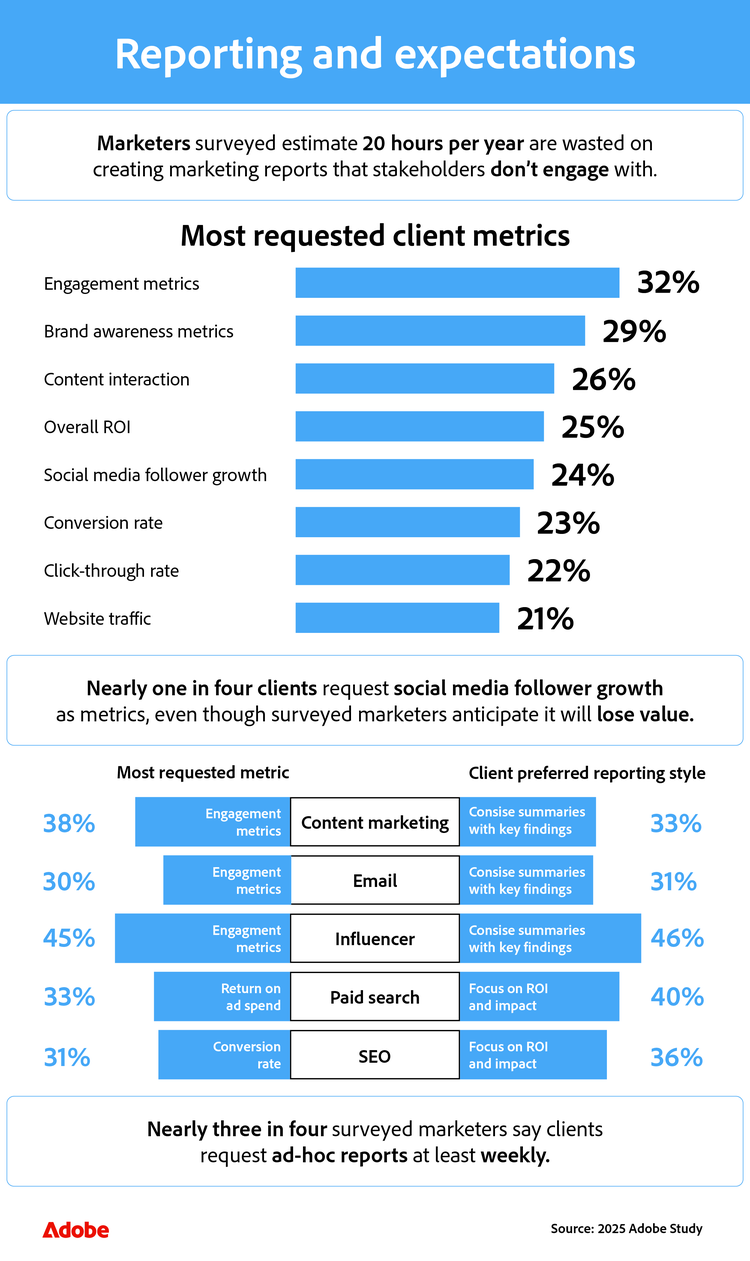
Despite all the tools and pressure to prove value, many marketers still struggle with ineffective reporting:
- Marketers waste 20 hours a year building reports that no one reads.
- For ROI reports, the number jumps to 27 hours.
- Clients request ad hoc reporting at least weekly — 28% more often than internal teams.
This mismatch leads to burnout, inefficiency and reports that drive limited action.
What stakeholders want from reports.
Surveyed marketers report key differences in how internal stakeholders and clients consume analytics:
- Internal teams prefer reports with actionable insights and strategic recommendations.
- Clients are more likely to favour short, jargon-free summaries.
- Both groups expect clarity — and fast turnarounds.
By aligning formats with audience needs and using tools like Adobe Customer Journey Analytics, marketers can streamline reporting and refocus on insights that matter.
Five measurement methods to assess marketing performance.
Want to better evaluate campaign impact? These five approaches help teams track influence across touchpoints and timelines:
1. Single attribution — first touch and last touch.
What it is: Credits all value to either the first interaction (lead generation) or the final interaction (conversion).
Business impact: Simplifies ROI tracking but may overlook other influential touchpoints.
Example: A manufacturing company credits a sale to the trade show that initiated the lead (first touch) or to the follow-up webinar that sealed the deal (last touch).
2. Single attribution with revenue projections.
What it is: Incorporates historical campaign data to predict longer-term outcomes.
Business impact: Accounts for delayed returns on marketing efforts, particularly in B2B buying cycles.
Example: Based on past results, a SaaS provider estimates that email nurturing campaigns targeting IT decision-makers will yield a 15% revenue increase within two quarters.
3. Attribution across multiple programmes.
What it is: Assigns proportional value to every touchpoint in the buyer’s journey.
Business impact: Provides a holistic view of campaign influence, improving resource allocation across channels.
Example: A financial services firm assigns weight to webinars, email campaigns and LinkedIn ads to determine their collective role in driving enterprise-level contract signings.
4. Test and control groups.
What it is: Measures campaign performance by comparing results between exposed (test) and unexposed (control) audience groups.
Business impact: Delivers precise insights into campaign effectiveness.
Example: A SaaS company compares personalised email campaigns against generic outreach, finding a 20% lift in engagement from the personalised group.
5. Marketing mix modelling (MMM).
What it is: Uses statistical models to evaluate the impact of marketing efforts alongside non-marketing factors, like economic conditions and pricing.
Business impact: Allows businesses to optimise budgets across multiple channels and variables.
Example: A B2B tech firm conducts MMM to evaluate the combined impact of LinkedIn ads, trade shows and content marketing while accounting for industry-wide demand fluctuations.
Getting started with marketing analytics.
Marketing analytics provides clarity on what’s working, what’s not and where to focus your efforts for measurable results. Implementing a successful programme starts with a clear strategy and the right tools.
Steps to get started:
- Set clear objectives: Define what you want to measure, such as ROI, conversion rates or retention.
- Centralise your data: Consolidate data from all channels, campaigns and customer interactions into one source.
- Adopt the right tools: Leverage advanced analytics platforms like Adobe Customer Journey Analytics to track, visualise and analyse performance data.
- Apply proven techniques: Use methods like regression analysis, attribution models and cohort analysis to uncover actionable insights.
- Act on insights: Turn findings into strategic actions, such as reallocating budgets, improving customer journeys or optimising messaging.
How Adobe Customer Journey Analytics helps.
Customer Journey Analytics empowers marketing teams to track performance across web, mobile and off-line channels in one place. With advanced segmentation, attribution and real-time data visualisation, you can:
- Connect fragmented data into a unified customer view
- Understand behaviours across every stage of the journey
- Deliver personalised experiences that convert
As marketing metrics evolve, so should your analytics strategy. With rising pressure to prove value — and fewer metrics that truly reflect it — now’s the time to shift from disconnected dashboards to decisions backed by insight.
Request a demo to see how Adobe Customer Journey Analytics can help your team move faster, smarter and with complete data confidence.
We surveyed 412 marketers across the United States to determine how marketing metrics are shifting. This sample size provides a 95% confidence level with a low 5% margin of error. Because this exploratory research relied on self-reported data, respondents may have biases and discrepancies may exist between their answers and their actual experiences.
Recommended for you
