Customer Journey Analytics and
Adobe Analytics are sibling products inside Adobe's CX Analytics portfolio, built for different scopes of insight. Adobe Analytics (branded "digital analytics") measures web and mobile behavior using its own native data collection, on a fixed report-suite schema locked at collection time. Customer Journey Analytics runs on Adobe Experience Platform, ingesting any online or offline data source, so it connects behaviors across web, app, call center, and in-store touchpoints using person-based identity stitching instead of session or cookie identifiers, and it lets you reshape reporting at report time rather than re-collecting data. Most enterprises run both: Adobe Analytics for focused web and app analysis, Customer Journey Analytics when the question spans channels and identities. Moving to Customer Journey Analytics is a matter of evolving your analytics, not a forced migration away from Adobe Analytics.
Customer Journey Analytics is one product inside
Adobe CX Analytics, the analytics portfolio Adobe introduced at Summit 2026 alongside Adobe Analytics, Adobe Customer Journey Analytics B2B Edition, Adobe Marketing Campaign Analytics, and Adobe Content Analytics. Within that portfolio, Customer Journey Analytics is the product for connecting behavioral and offline data into a single, identity-resolved customer profile, then exploring it visually with AI-assisted tools rather than fixed dashboards. It combines behavioral and trait data across channels and devices, supports flexible ad hoc analysis with retroactive data manipulation, and uses AI to surface insights and predict outcomes, all built for business users, not only analysts.
Customer Journey Analytics is built for enterprise teams that need marketing, product, and analytics aligned on one source of truth, and it removes the specific barriers that make customer intelligence slow today. That includes: CMOs and marketing leaders optimizing journeys across paid, owned, and earned channels and
measuring campaign performance without waiting on IT; product and digital teams tracing how features affect conversion and engagement across app, web, and in-store experiences; analysts and insights teams that need to run retroactive queries and self-serve exploration at scale instead of fixed reports; CIOs and data leaders who need policy-based governance enforced while still giving teams safe, self-service access to the same data. Getting value depends on connecting real cross-channel data into Adobe Experience Platform first; the analysis itself does not require analyst-level tooling once that data is flowing.
Customer Journey Analytics lets you change
data fields, session definitions, and reporting views at report time, non-destructively, without reprocessing pipelines, rewriting code, or touching the source dataset, and every governance control travels with that flexibility rather than being traded off against it. Because Customer Journey Analytics is built on Adobe Experience Platform, it inherits Experience Platform's data governance framework: usage policies and sensitivity labels apply to the underlying data, role-based permissions restrict who can see or export it, and in-product alerts flag policy violations before they happen. Business users get to self-serve new questions; the label and permission model stays enforced underneath them.
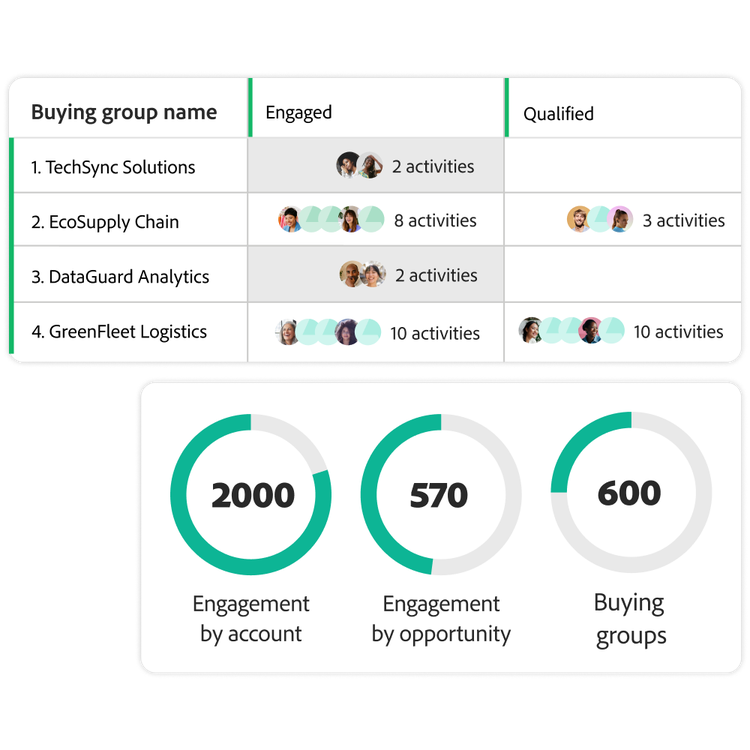
Yes. Customer Journey Analytics shares
audiences directly with Real-Time CDP and Journey Optimizer, so an audience you define from behavior, campaign response, or cross-channel journey data in Analysis Workspace can be activated for targeting and orchestration without exporting it elsewhere. Performance results from that activation can be re-ingested back into Customer Journey Analytics, closing the loop between analysis and the next decision rather than leaving analysis as a one-way report.
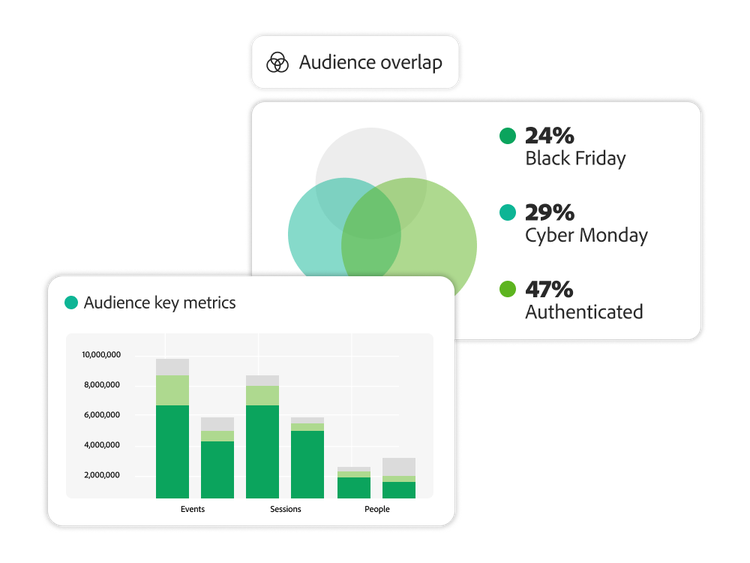
Customer Journey Analytics connects identity and interaction data across every touchpoint, online and offline, so you can trace a full journey sequentially instead of reading channel-siloed reports. In Analysis Workspace you can see what drives engagement, drop-off, or conversion at each stage, compare the paths different customer segments take to find friction or missed opportunities, and use
AI-assisted analysis to surface trends and anomalies as they emerge. That full-journey context lets teams move from reactive reporting to proactively redesigning an experience and to measuring if a content or product change moved the journey.
Yes. Customer Journey Analytics is built on
Adobe Experience Platform, and a Customer Journey Analytics license is required to access the application; there is no standalone version that runs independently of Experience Platform. In practice this means your data needs to reach Experience Platform, whether from web and app SDKs, offline sources, or existing Adobe Analytics report suites, before Customer Journey Analytics can report on it.
Your existing Adobe Analytics report suite data flows into Customer Journey Analytics through the
Analytics source connector, which brings it into Adobe Experience Platform without requiring you to re-instrument your site or app. From there it becomes a connection you curate into one or more data views, the Customer Journey Analytics equivalent of a virtual report suite, so you keep your historical Adobe Analytics data while gaining report-time flexibility and the option to join it with offline or other channel data as you add sources. This is an evolution of your existing setup, not a rebuild from zero.