Adobe report: U.S. consumers are embracing LLMs to make travel plans, but many brands have AI visibility gaps.
The typical travel planning process is undergoing a major shift, as consumers increasingly delegate tasks to large language models (LLMs). Instead of manually cross-referencing multiple websites and aggregators, travelers are turning to AI-powered chat services and browsers to construct nuanced itineraries, identify unique experiences, and locate relevant promotional offers. Once the research is done, users are clicking through to a brand website to complete their booking.
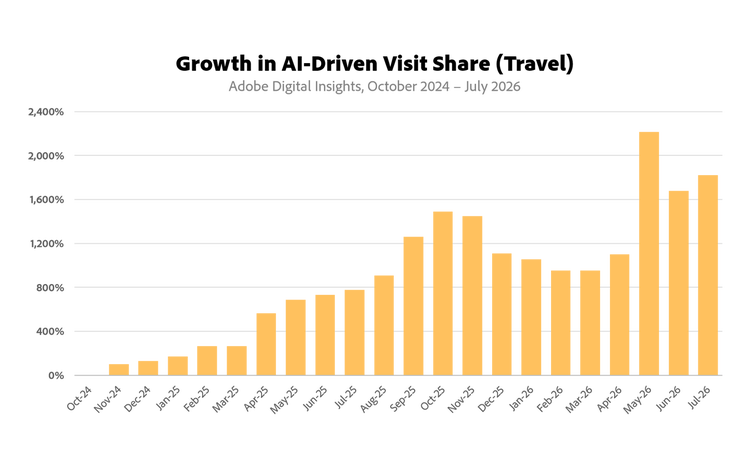
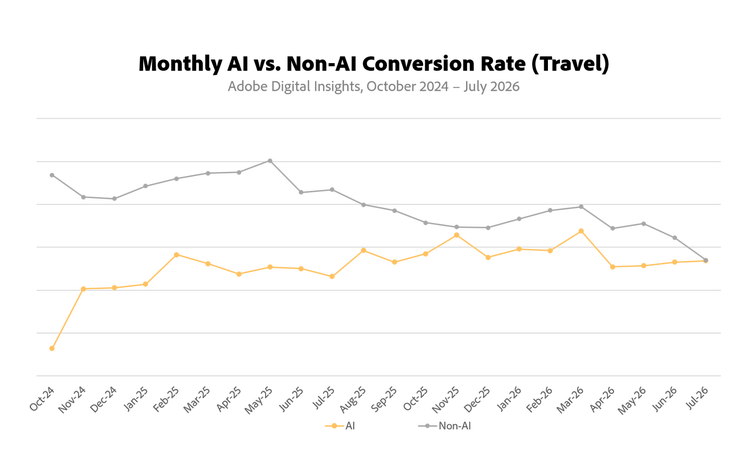
This trend has accelerated in recent months per new data from Adobe, with AI traffic to travel sites up 119% year-over-year (YoY) in July 2026. These users also have high purchase propensity, with conversion now on par with non-AI channels such as paid search or email. This shift parallels what we’ve seen in the retail sector, where AI has become a primary interface between consumers and their favorite brands, for researching products or finding the best deals.
Adobe’s data also reveals a major bottleneck across both sectors: Significant portions of U.S. travel and retail sites remain unreadable to machines, restricting their presence across AI search results. When an LLM cannot easily read brand content (such as amenities, pricing or availability), potential revenue is being left on the table.
Our latest insights are based on direct transactions online, covering over 1 trillion visits to U.S. retail sites—more than any other technology company or research organization. A companion survey of more than 5,000 U.S. respondents (conducted in July 2026) also provides additional context on how consumers are leveraging AI in their daily lives.
AI traffic to U.S. travel sites continues to surge.
In July 2026, AI traffic to U.S. travel sites grew 119% YoY, which is measured by users clicking on a link to a travel site. If we go back to October 2024, when Adobe first began tracking this space, AI traffic is up a staggering 1,822% through July. Adobe’s survey also pinpoints ‘research’ as the primary AI use case for travelers (per 43% of respondents), followed by getting inspiration (43%), transportation planning (41%), and itinerary creation (34%). Additionally, 84% of respondents said that using AI for travel planning improved their experience.
Notably, AI traffic now converts nearly as well as non-AI traffic (visits that become purchases). In July, AI conversion was a than non-AI. This is a massive shift from just one year ago (July 2025), where AI traffic conversion was . Rising consumer trust has played a factor here, with Adobe’s survey showing that 95% of respondents who use AI tools believe the responses to be just as trustworthy as traditional search. This is giving travelers more purchase confidence and ultimately driving transactions on brand websites.
The narrowing AI conversion gap is reinforced by Adobe’s data on engagement and bounce rates. Data from July showed that once an individual lands on a U.S. travel site (from an AI source), the engagement rate is 21% higher compared to non-AI traffic. These travelers are spending more time on the website (visits are 67% longer) and less likely to leave (42% lower bounce rates).
Many U.S. travel sites have AI visibility gaps.
Adobe’s AI Content Visibility Checker provides a diagnostic tool that can analyze any web page and identify what LLMs can or cannot read. New data from Adobe profiles web pages across hotels, cruise lines, car rental services and airlines—providing a benchmark on AI visibility. The AI Content Visibility Checker assigns a score out of 100%. So, if a webpage receives a score of 50%, this means half of its content is not readable by machines.
Across the U.S. travel sector, the average score for hotel homepages came in at 71%. This means over a quarter of the content on these homepages has not been optimized for LLMs. The score dips to 70% for cruise lines, 64% for car rental services, and 42% for the airlines. While the travel sector has often focused on rich visual content to inspire travelers, the data shows the importance of having detailed text-based content that can be easily read by machines.
We also drilled into product pages, where cruise lines led the pack with a score of 76% (pages on itineraries and ship options, for example). This is followed by car rentals at 73% (vehicle offerings), hotels at 68% (different properties) and airlines at 59% (routes and fares). While the scores are higher, there remain AI visibility gaps across the board.
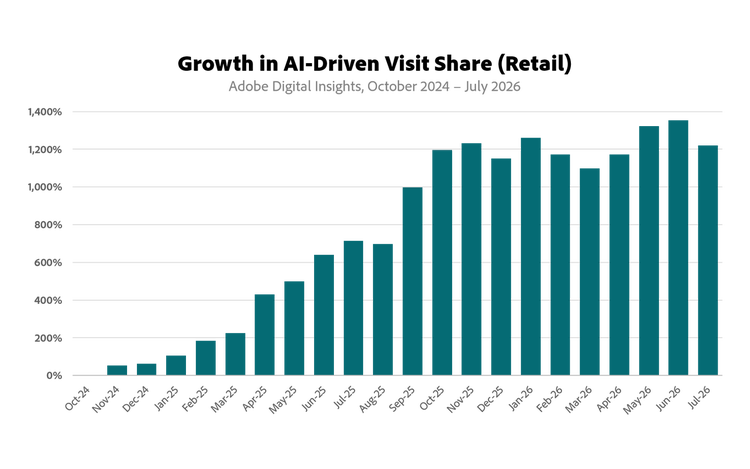
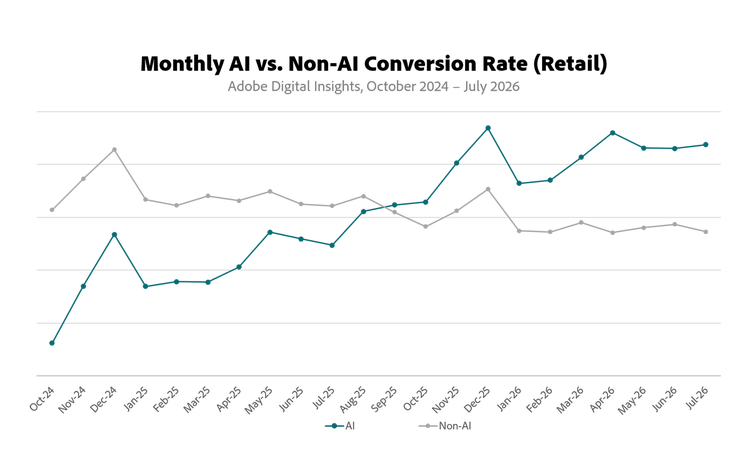
In July 2026, AI traffic to U.S. retail sites was up 62% YoY, sustaining the momentum observed in recent months. From October 2024 through July, it is up a significant 1,219%. Traffic from AI sources also continues to convert better (60% higher) than non-AI traffic, marking the 11th consecutive month where AI conversion has pulled ahead.
The July data also shows that when visitors arrive at a U.S. retail site (from an AI source), the engagement rate is than non-AI traffic. Specifically, these shoppers spend 59% more time on the site and are 33% less likely to bounce. AI-referred visitors also add items to their shopping cart at a . These figures demonstrate the ongoing value AI provides in the e-commerce sector, reducing time required for shoppers to locate desired products or find relevant deals.
Many U.S. retailers, however, continue to have AI visibility gaps. In April 2026, data from Adobe showed that the average score for homepages came in at 75%. This means roughly a quarter of the content on homepages has not been optimized for LLMs. In July, we expanded the analysis to a broader set of U.S. retail sites and found that homepage visibility dropped to , meaning nearly 40% of homepage content is not fully readable by machines.
We also have new data on different types of retailers, across categories such as apparel, electronics, and cosmetics. For this analysis, the scores measured overall readability—across homepages, product pages, corporate blogs, and more. The scores are as follows:
- Apparel: 76%
- Electronics: 70%
- Cosmetics: 68%
- Sporting Goods: 67%
- Furniture & Home: 64%
- General Merchandise: 63%
- Grocery: 59%
This data shows that apparel, electronics, and cosmetics lead the pack, where consistent and structured product content is helping drive AI visibility. All three of these categories are also bolstered by a stronger showing across earned (press stories) and owned content (corporate blogs), leading to a higher overall score. For the remaining categories, the data highlights a need for teams to update their digital properties and ensure content can be easily parsed by machines.
Overall, Adobe’s data highlights that while U.S. travel and retail brands have established a baseline for AI visibility, critical adjustments are still needed. As consumer adoption of AI tools continues to accelerate, these brands must ensure their full ecosystem of digital content is fully optimized for LLMs, to maintain visibility and relevance in today's market.