USE CASE 1:
Content as a Service v3 - customer-journey-analytics - Thursday, July 17, 2025 at 11:55


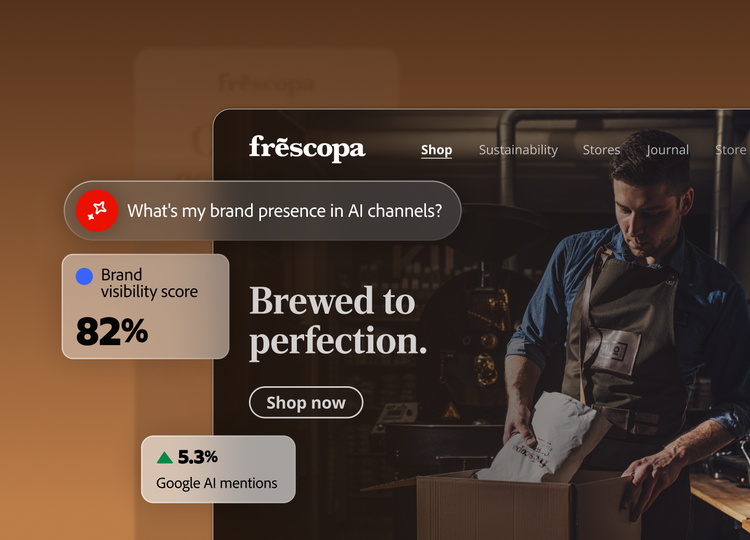
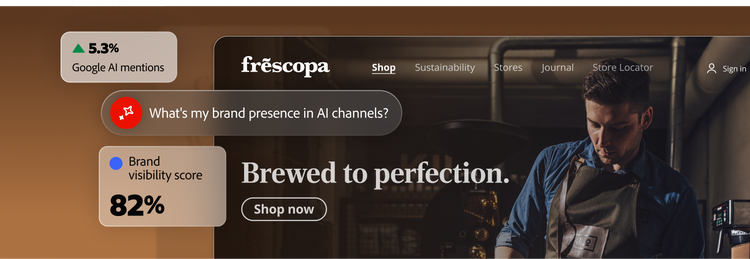
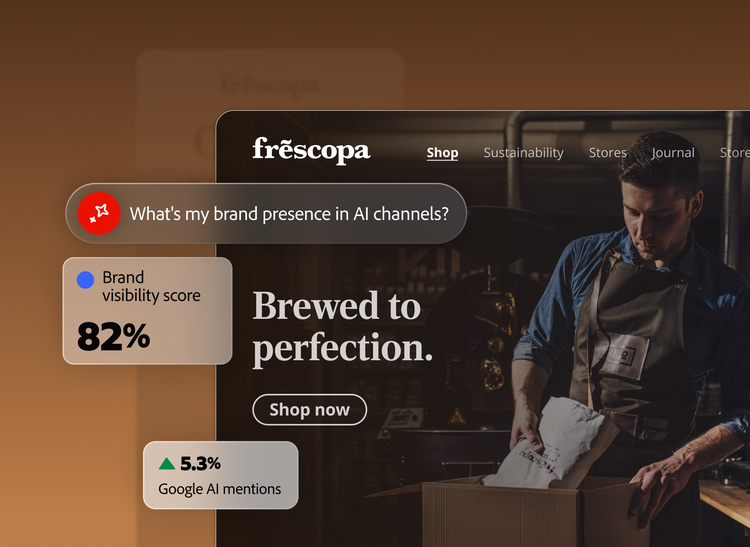
Explore how LLM Insights helps organizations bring AI discovery into their analytics strategy, giving teams a clearer way to evaluate visibility, customer engagement, and business impact.
LLMs are the new front door to digital discovery. Prospects are increasingly turning to platforms like ChatGPT, Claude, and Google AI Overviews to research products, compare options, and make purchase decisions before ever visiting a brand's website.
According to Bain & Company, 80% of consumers rely on AI-generated answers for a significant portion of their searches.
But most organizations lack visibility into how AI-driven discovery contributes to business outcomes. Teams struggle to understand how much traffic and engagement is driven in LLMs, which content is surfaced or cited, and how LLM-referred journeys are influencing downstream conversions.
Disconnected data across multiple systems only makes matters worse, with visibility insights, customer engagement metrics, revenue data, and bot activity often living in separate platforms.
LLM Insights in Adobe Customer Journey Analytics closes that visibility gap by connecting AI-driven discovery with customer engagement and revenue outcomes. The result is a unified view of both AI-driven and human-driven journeys, enabling organizations to measure the business value of AI-led discovery and optimize experiences.
To measure AI-driven journeys, organizations need to connect what happens across AI services with what happens across owned digital experiences. LLM Insights in Customer Journey Analytics brings those views together.
Adobe Brand Visibility helps organizations understand how their brand appears and performs across AI-powered experiences with insights into brand mentions, citations, share of voice, agentic traffic, referral traffic, and prompt-level interactions.
Customer Journey Analytics complements this view by connecting those signals to sessions, customer journeys, funnel progression, conversions, revenue, retention, churn, and attribution.
The following use cases show how that connected view can help organizations answer the questions that matter most: where AI-driven traffic fits in the acquisition mix, which AI-visible pages are underperforming, how AI brand presence relates to demand and revenue signals, and which optimization actions are improving performance.
USE CASE 1:
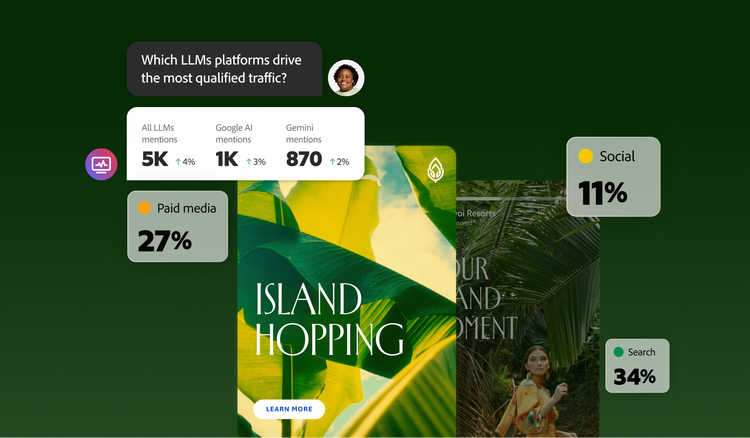
AI search and assistants are emerging as an acquisition channel for brands as more discovery happens through AI-generated answers. Brands need to understand how much traffic these platforms generate, which AI sources send the highest-value visitors, and how that traffic compares with search, paid media, email, and social.
But AI-driven journeys are harder to capture because LLMs often access content through bots, retrieval systems, and CDN infrastructure, leaving standard browser-based analytics with an incomplete view.
The result is a channel-mix blind spot: teams can measure traditional acquisition channels clearly, but struggle to understand where AI fits into their acquisition strategy.
LLM Insights helps teams bring AI-driven acquisition into the same reporting environment they already use to evaluate other channels.
Brand Visibility identifies the AI platforms, prompts, citations, and referral paths associated with inbound traffic. Customer Journey Analytics brings that traffic into channel reporting, so teams can evaluate AI-referred journeys alongside search, paid media, email, and social.
Because AI-driven traffic is analyzed inside existing Customer Journey Analytics workflows, teams can compare LLMs with other digital acquisition channels without creating an analytics silo.
With AI-referred traffic visible in channel reporting, teams can decide how LLMs fit into the acquisition mix. They can:
For example, a large retailer may know AI-driven traffic is growing across the industry but not how much of that traffic it is capturing. By using Brand Visibility to detect citations and referral clicks from platforms such as ChatGPT, Gemini, and Claude, then bringing those signals into Customer Journey Analytics as a GenAI acquisition channel, the retailer can compare AI-driven traffic against traditional channels.
LLM Insights helps analytics teams bring AI-driven acquisition into the same measurement discipline they use for other channels. They can build unified reporting that shows where AI-driven traffic fits with search, paid media, email, and social.
This connected view helps marketing and business teams compare AI-referred visitors with other acquisition audiences and see whether AI is becoming a distinct part of the acquisition mix.
USE CASE 2:
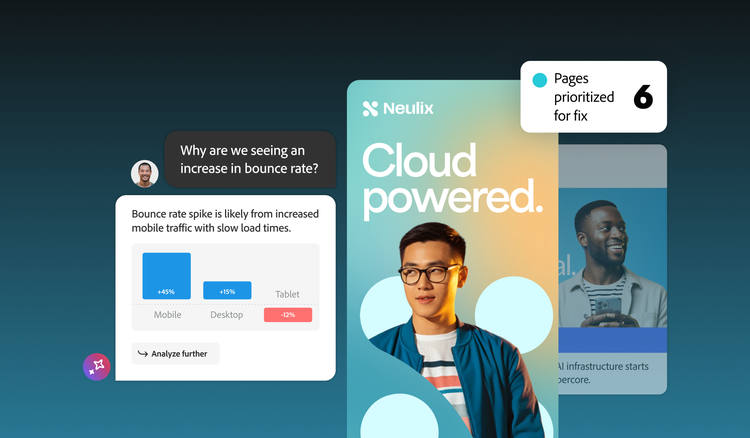
Brands are increasingly investing in improving their visibility across AI-powered experiences. However, those efforts don’t always translate into conversion. LLMs frequently cite or recommend certain pages, driving referral traffic. But organizations lack insight into what happens once customers arrive.
This creates a crucial measurement challenge. Brands need to understand which AI-referred landing pages successfully convert visitors into customers and where users encounter friction.
Brand Visibility identifies which pages receive the highest visibility in AI-generated answers, including citations, landing URLs, and referral traffic in LLMs. Customer Journey Analytics then measures what happens after visitors arrive, including bounce rate, engagement depth, conversions, revenue, and other customer journey metrics.
By connecting these views, LLM Insights helps detect where AI-referred visitors drop off, which experiences create friction, and which high-visibility pages need attention first.
When teams connect AI visibility signals with journey data, they can:
For example, an electronics retailer may discover that several buyer’s guide pages are frequently cited by AI assistants and receive high referral traffic. By combining Brand Visibility with Customer Journey Analytics, the retailer can see that mobile visitors bounce at a higher rate and many users abandon the financing step during checkout. Based on these insights, the team can prioritize page-level fixes, such as shorter forms, clearer CTAs, and improved mobile usability for the AI-visible pages with the greatest conversion gap.
LLM Insights helps analytics teams move from measuring AI visibility to improving the performance of AI-referred journeys. This shared view helps marketing and digital experience teams prioritize improvements on the pages that receive meaningful AI-driven traffic but fail to move visitors toward revenue-generating actions.
USE CASE 3:
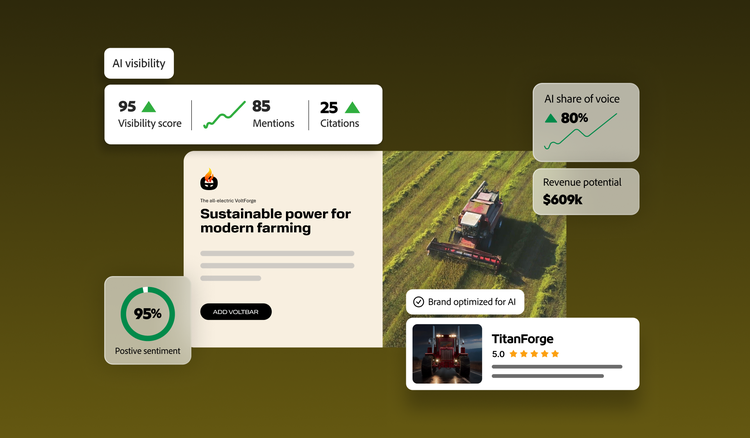
AI brand presence is becoming an important signal of authority, but it is often measured separately from demand and pipeline performance. Teams may be able to track mentions, citations, sentiment, and share of voice across AI-generated answers, but lack a clear way to connect those signals with qualified leads and revenue.
Organizations need to understand whether stronger presence around priority topics is associated with deeper engagement, more qualified leads, higher-intent actions, and influenced revenue.
By connecting AI brand presence with customer and pipeline outcomes, LLM Insights helps teams understand whether authority in AI-generated experiences translates into measurable business value.
Brand Visibility measures brand mentions, citations, sentiment, and share of voice across leading LLMs and third-party sources like Reddit and Wikipedia. Customer Journey Analytics connects these signals to engagement and conversion metrics, including lead form submissions, trial downloads, demo requests, influenced pipeline, and revenue.
When AI visibility and customer journey data work together, teams can identify which topics or content investments have the strongest relationship with business performance rather than measuring AI presence in isolation.
When teams have a unified view of AI brand presence and pipeline performance, they can:
For example, an industrial manufacturer invests heavily in thought leadership around topics like predictive maintenance and safety valves. This improves their AI visibility. But the brand still struggles to determine whether this is influencing sales opportunities. By using Brand Visibility to measure sentiment and share of voice for these topics and connecting that data to Customer Journey Analytics, the company can correlate improvements in AI visibility with relevant outcomes and alter future content investments accordingly.
LLM Insights helps teams turn AI authority into a planning signal. Instead of prioritizing topics only because they generate mentions or improve share of voice, teams can focus on areas where stronger AI presence aligns with customer interest, lead quality, and revenue potential.
That gives content, SEO, communications, and business teams a clearer basis for deciding which topics to invest in next and helps leaders evaluate AI authority as part of demand strategy, not just brand visibility.
USE CASE 4:
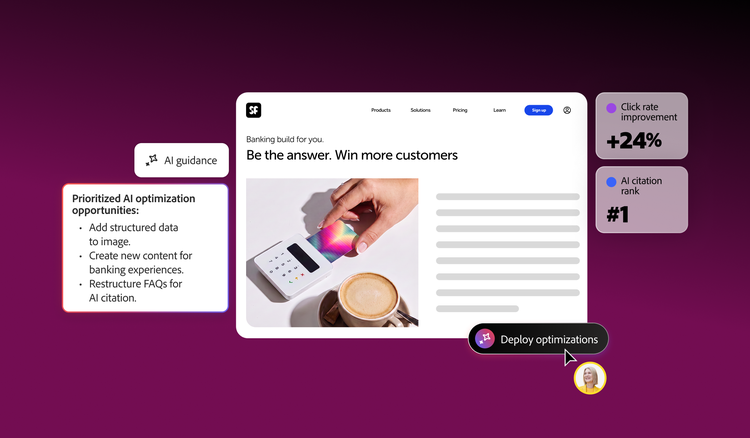
As brands invest in AI optimization, they need to know which actions are actually improving visibility and business performance. Competitive gaps can show where the brand is losing ground across priority prompts, topics, or buying journeys, but they do not always reveal the right fix.
The issue could be content depth, crawlability, structured data, third-party authority, product information, or page experience. Without a connected view, teams struggle to know which changes are closing those gaps, increasing qualified traffic, or contributing to conversions and revenue.
LLM Insights helps teams connect AI optimization actions to changes in visibility, traffic, and downstream performance over time.
Brand Visibility measures brand presence across AI platforms, including share of voice and competitive performance for priority prompts and topics. It also recommends content and technical optimizations, such as improving FAQs, product pages, eligibility content, and structured data. Customer Journey Analytics then measures how those optimization efforts influence customer outcomes, like trial applications, sign-ups, orders, and revenue.
By combining competitive AI insights with customer journey data, organizations can prioritize the optimizations most likely to drive results.
With competitive AI visibility, optimization activity, and journey outcomes connected, teams can evaluate AI optimization as a performance program rather than a set of disconnected content or technical fixes. They can:
For example, a retail bank may discover through Brand Visibility that its checking account products appear in only a small percentage of AI-generated recommendations, while competitors dominate the same prompts. The bank can then prioritize improvements to FAQs, rate tables, and eligibility pages based on recommendations by Brand Visibility.
LLM Insights helps organizations move from competitive benchmarking to measurable optimization. Adobe has seen a 41% increase in LLM referral traffic and more than 200% growth in citations following optimization efforts, with CJA helping translate those improvements into an attributable pipeline.
The value comes from connecting competitive benchmarking, AI visibility, and optimization recommendations with customer journey and conversion data, giving teams a clearer basis for continued AI optimization efforts.
AI discovery is becoming too important to manage through disconnected signals or isolated experiments. Analytics and marketing teams need a clearer way to see where AI is influencing the journey, which opportunities deserve attention, and where optimization can create business impact.
Organizations that build this capability now will be better positioned to adapt as AI increasingly influences discovery, engagement, and decision-making. LLM Insights in Customer Journey Analytics gives organizations the foundation to act on that shift with more clarity, evaluate AI with the same rigor as other digital channels, and focus efforts where they can drive better outcomes.
Explore LLM Insights in Customer Journey Analytics to better understand your brand presence in LLMs.