Content as a Service v3 - consumer-goods - Friday, August 29, 2025 at 10:02
JUMP TO SECTION
Three Opportunities Emerge from This Year’s Data
Results Across the Index Pillars
A New Front Door for Public Services
Guiding Every Resident Through the End-to-End Digital Journey
The Anatomy of Best-in-Class Digital Government Service Delivery
Advancing Digital Government in the United States: What Adobe’s Latest Index Reveals
Digital government in the United States is entering a new phase. The focus is expanding beyond online availability to whether residents can find, access, and complete services with confidence. At the same time, AI is changing the front door to government information and services, reshaping how citizens discover and act on what they need.
Adobe’s Digital Government Index for the United States shows how states are responding. It highlights where progress is being made, where delivery breaks down, and how outcomes-based delivery, digital cohesion, and discoverability shape better outcomes for citizens and government.
The report shows how leading states are aligning strategy, technology, and experience design to support consistent, end-to-end delivery.
Adobe Foreword
Governments across the United States are being asked to modernize digital service delivery in a landscape that leaves little room for organizational transformation. New policy demands are arriving rapidly, and legacy systems are becoming more expensive to maintain, while procurement and implementation cycles remain slow.
For many states and agencies, the operational challenge is how to improve services fast enough to meet residents’ expectations while managing fragmented systems, disconnected decisions, and long-standing technical debt. This means that continual response replaces steady transformation.
The fifth edition of Adobe’s Digital Government Index for the United States sits at the intersection of two important shifts. Accessibility has become a more urgent focus for state and local government digital teams, amid stricter requirements for websites and mobile applications and extended compliance timelines. In response, governments have been reviewing digital properties, improving content and design standards, and building accessibility more deliberately into service delivery and governance.
Those efforts are unfolding as AI reshapes how services are found, accessed, and interpreted. Without a comprehensive federal framework, states are moving ahead with their own legislation, guidance, and governance models, creating a fast-changing policy landscape around the use of AI in government and beyond. That combination of stronger compliance expectations and a less settled environment is changing where digital leaders must focus.
For the Digital Government Index (DGI), the benchmark has evolved to reflect the realities of modern government. Navigation, service design, and platform performance remain important, but citizen outcomes increasingly depend on how well governments build trust, enable discovery, and adapt to change.
As AI increasingly functions as an active layer between government service delivery and citizens’ needs, we’ve introduced a new AI Readiness measure in this edition. Government now operates in a context where search, service access, and public information are being reshaped by AI, even as policy settings, internal capability, and technical foundations remain uneven.
The emerging picture is of a public sector balancing multiple, often conflicting pressures. The challenge now is to strengthen foundations and reduce cost and complexity. At the same time, services need to be easier for citizens to find and navigate, supporting more seamless end-to-end interactions across government.
This report examines how states are performing across that landscape, where momentum is building, and where underlying weaknesses continue to constrain what digital government can deliver for the people it serves. As you review the findings, we encourage you to consider the suggested action items at the end of the report and identify one practical step your organization can take to strengthen digital maturity.

Brian Chidester
Key Insights
Three Opportunities Emerge from This Year’s Data
Now in its fifth year, the DGI provides a longitudinal view of how digital services are delivered and experienced across the United States. The 2026 results point to clear opportunities to improve performance and show that leading states are already making headway.
This report explores where progress is emerging, what is holding delivery back, and the practical pathways agencies can take to strengthen digital government and constituent outcomes over time.

AI Discoverability
Content can be found but is not always cited

Digital Cohesion
Potential for performance and compliance trade-offs

Outcomes-Based Delivery
Self-service and experience drive outcomes
The Digital Government Index
Understanding How and Why Digital Delivery Performance Is Measured
The DGI assesses how effectively public sector organizations deliver digital services, helping decision-makers track progress, identify gaps, and prioritize investment. It scores Customer Experience, Site Performance, and Digital Self-Service out of 100, drawing on user testing, technical analysis, and third-party data, then combines the results into a single, equally weighted index score that benchmarks digital maturity.
Two additional enablers — Personalization and AI Readiness — shape how well services remain relevant, discoverable, and easy to use. Personalization is assessed based on how well services adapt to user needs, context, and behavior across the journey. AI Readiness is evaluated through signals that indicate how well services are recognized, surfaced, and interpreted by AI-driven systems and large language models (LLMs).
Foundational Digital Maturity

Customer Experience

Site Performance

Digital Self-Service
Digital Enablers

Personalization

AI Readiness ** New in 2026 **
The 2026 DGI National and State Results
A Steady Upward Trend, But Momentum Is Uneven
The 2026 results show continued uplift in performance across U.S. digital government. Momentum is slowing in some areas as early improvements plateau, shifting the focus to integration, optimization, and outcome-driven design.
2026 Digital Government Index for the United States Scores
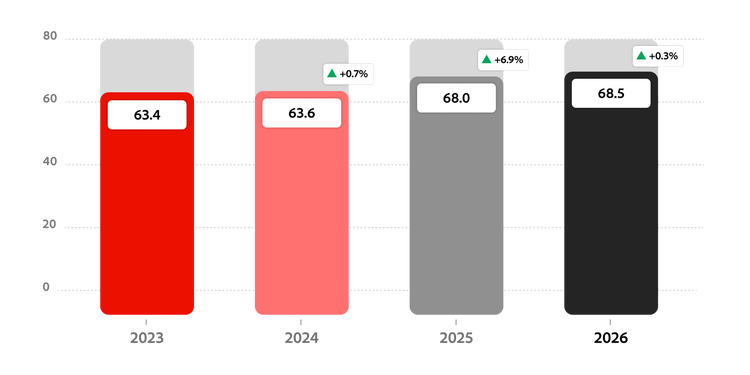
The results point to a more demanding phase of digital maturity, where progress depends not only on improving individual services but on changing how digital delivery is organized, funded, and measured across government. Scores range from 52.1 to 77.5, demonstrating variation across states at different stages of maturity.
DGI Maturity Scale

The maturity scale represents current capability, not an end state. As expectations and technologies evolve, so does the definition of high performance. Higher maturity shows an ability to adapt and improve, requiring integration, team alignment, and ongoing service design refinement.
What Sets the Top-Performing States Apart
The 2026 DGI Top-Performing States
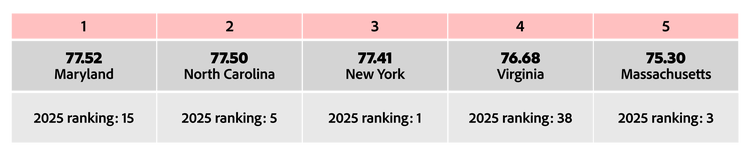
Treating delivery as service design rather than an IT rollout, with a focus on accessibility and usability, is a common approach among leading states. This is demonstrated through common infrastructure, embedded governance, built-in measurement, and a clear resident outcome focus. More broadly, DGI scores vary widely across the United States.
DGI Performance Across United States

Results Across the Index Pillars
Customer Experience
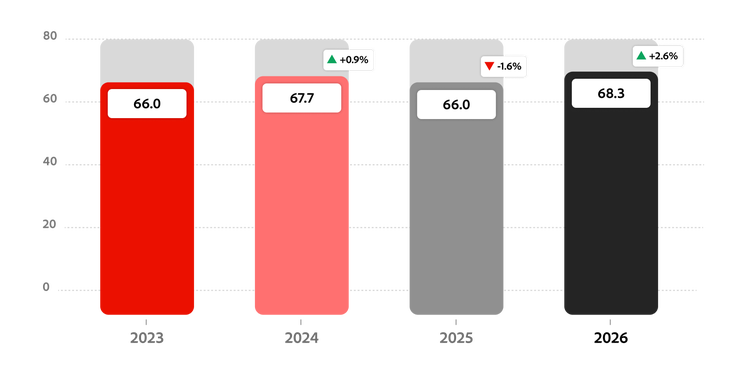
What it measures: User experience across mobile and desktop service interactions.
National result: CX improved in 2026, but results are uneven year-over-year. While some states are strengthening end-to-end digital interactions, consistency is still not firmly embedded.
Site Performance
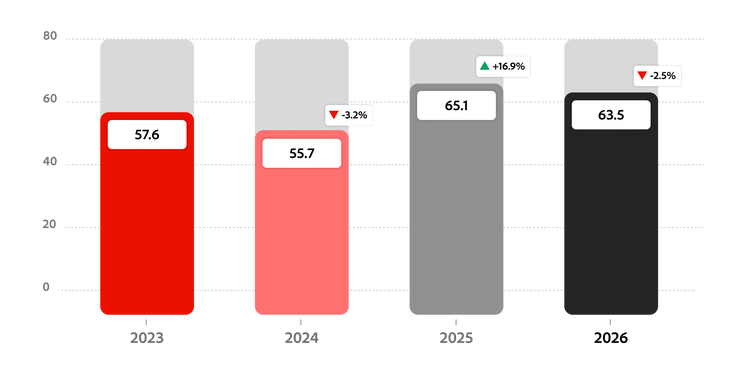
What it measures: State website speed, authority, and overall health.
National result: Performance slipped in 2026 after sustained improvement, pointing to strain as service complexity grows. Slower desktop speeds drove the decline, with third-party tools and integrations likely contributing to the drop.
Digital Self-Service
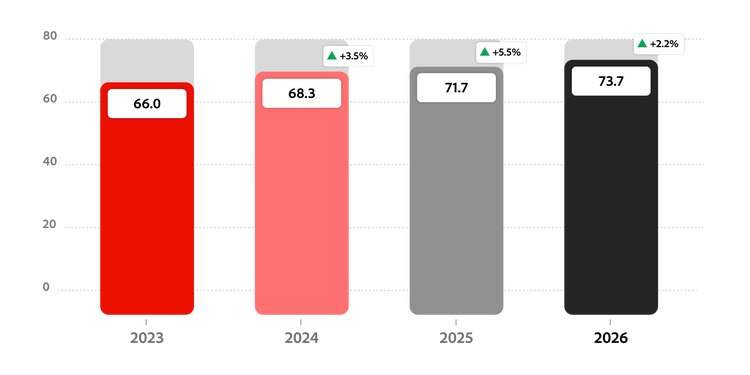
What it measures: Accessibility conformance, language translation availability, content readability.
National result: Digital Self-Service continues to improve, with steady uplift driven by investment in task completion, accessibility, and regulatory requirements shaping more structured, user-friendly design.
AI Readiness Spotlight
A New Front Door to Public Services
AI is changing how citizens find services, shifting visibility from search to inclusion in AI responses. A gap remains between content that is accessible and content that is cited, making authority and clarity critical to effective delivery. The change has also introduced new governance risks, as misinterpreted content threatens public trust.
AI Readiness Individual State Scores and Range
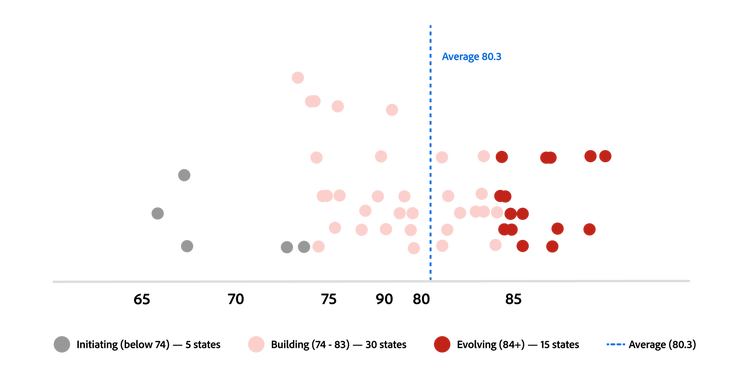
AI Readiness scores vary widely, demonstrating differences in technical platforms, service models, and content governance. As with DGI foundations, higher scores do not indicate a fixed end state. AI-driven discovery is still evolving, and leading agencies continue to adapt. Three areas are assessed:
Average AI Readiness Scores by Pillar

Personalization Spotlight
Guiding Every Individual Through the End-to-End Digital Journey
Personalization is a key indicator of whether digital services are citizen-centric and conducive to journey completion. Adobe assessed the presence of personalization capabilities at key engagement points, producing an overall average score for state portals and HHS agencies.
Across both state portals and HHS agencies, personalization is most visible in site search, where tailored results can help residents locate relevant information or services quickly. Lower scores for chat assistance, service updates, and personalized forms point to an opportunity to build strong self-service capabilities, helping reduce drop-offs and reliance on assisted channels.
Average Personalization Capability Across Citizen Journey Stages
State portal
Health and Human Services
Services and updates
0.6
0.6
Site search
1.3
1.2
Login experience
1
0.9
Forms (mobile)
1.1
1
Forms (desktop)
1.1
1.1
Chat assistance
0.5
0.3
Scoring scale - 0: capability not present, 1: basic capability present, 2: advanced capability present
What the Results Signal
Digital government effectiveness is increasingly measured by whether people can successfully complete the tasks they set out to do end-to-end online. However, structural barriers continue to hinder how services are designed, connected, and experienced, limiting governments' ability to deliver seamless outcomes at scale.
Discoverability Is Shifting Beyond Government Control
The way citizens find and engage with government services is changing, as traditional search gives way to AI-driven discovery. Information is no longer competing for rankings and clicks, but is being selected, summarized, and presented by AI systems, often without users visiting official sites. Visibility now depends on how well information is structured, recognized, and trusted within AI-generated responses. Referral traffic from LLMs has risen sharply and is now an important metric that helps understand how well domain authority and site performance surface information within AI-generated responses.
Priority Metrics for Improving AI Readiness
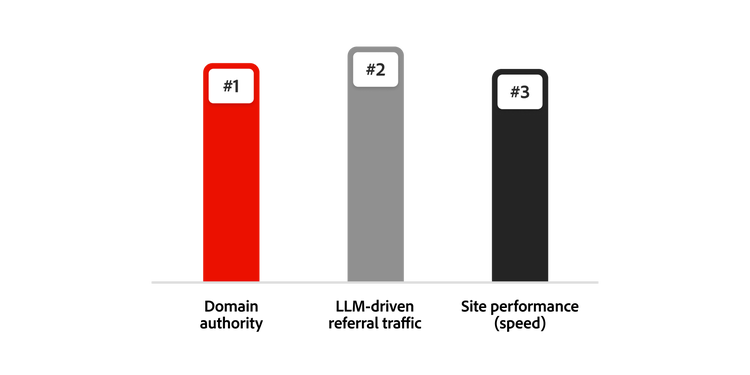
DGI data shows agencies are not yet fully adapted to an AI-driven search economy. Crawlability scores are high, meaning content can be accessed by AI systems, but brand recognition and agency site attribution lag. On average, crawlability exceeds recognition by around 15%, highlighting a gap between information that is available and information that is actually cited.
Trust in AI-generated information remains fragile, with around 35% of outputs estimated to amplify false or misleading content1. Where official information is not structured or authoritative, it is more likely to be replaced or supplemented by less reliable sources, reducing government control over how services are presented and understood. The shift is already visible in traffic patterns, with visits to government sites projected to decline by up to 50% by 20282.
What This Means
Discoverability is no longer shaped by government platforms alone. As AI prioritizes structured, authoritative, and relevant information, agencies that fail to adapt risk losing visibility and influence over how services are found.
What To Do
- Structure content for machine interpretation as well as human use. Ensure content is clearly labeled, consistently formatted, and employs clean information architecture.
- Strengthen authority signals beyond owned channels. Build a presence across trusted third-party sources and reinforce domain credibility so AI systems recognize and prioritize official information.
- Develop a GEO approach and design content to improve discoverability, attribution, and citation within AI-generated responses, ensuring authoritative information is surfaced accurately and consistently.
- Monitor how content is surfaced and represented. Track how services appear in AI-generated responses to identify gaps in visibility, attribution, and accuracy, and refine content accordingly.
Case Study: Visibility Driven by Authority and Optimization — Adobe on Adobe
The impact of strengthening AI visibility is reflected in Adobe’s own optimization efforts. By improving content structure, authority signals, and AI-facing performance, Adobe increased citation visibility across LLM platforms by more than 200% relative to competitors, alongside a 41% increase in traffic from AI-driven sources. These results highlight a broader lesson. In an AI-mediated landscape, discoverability depends on being selected and trusted, not just available. Organizations that actively optimize for this shift are more likely to retain visibility and influence as search behavior continues to evolve.
Service Experience Is Not Designed for Completion
Delivering intuitive end-to-end experiences is critical to increasing the uptake of government services. However, the DGI indicates that many states continue to design and measure digital services as discrete touchpoints rather than complete user journeys.
User testing shows early-stage interactions perform relatively well. Residents can generally find relevant information and orient themselves on landing pages, which remain the strongest stages of the journey. Performance then declines toward enrollment and task completion, with service velocity and information intelligence recording the steepest year-on-year decreases.
Changes in Customer Experience Touchpoints Based on Resident Surveys (2025 vs. 2026)
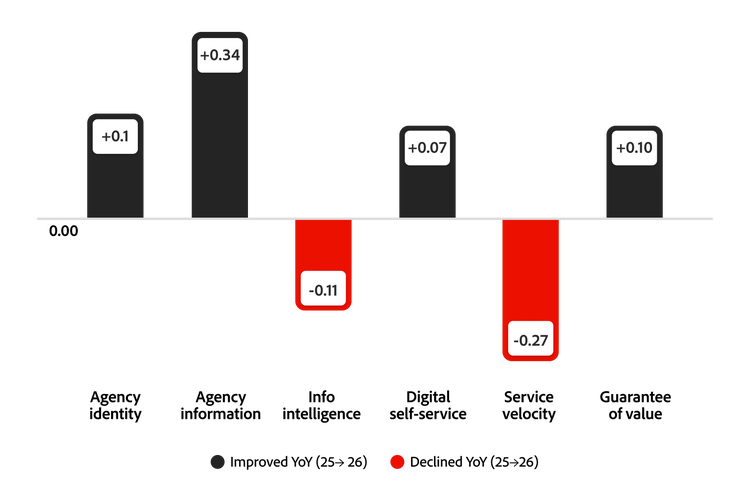
This decline reflects how digital capabilities are distributed across the user journey. Most state portals provide strong entry-point functionality, including service directories, personalized content, and search capabilities. As users move into more complex stages that require identity verification, account creation, or personalized services, available support diminishes.
Nine in ten agencies provide service listings and search functionality. In contrast, just under two-thirds offer authenticated experiences, and only 29% offer chatbot or AI-assisted support. This gap is reflected in user sentiment. Despite widespread availability of digital services, 49% of residents report difficulty navigating government platforms3, and 74% rate their interactions as not user-friendly4.
What This Means
Access alone is not enough when performance weakens at the point users need to act, causing digital services to increase friction, limit uptake, and fall short of their intended outcome.
What To Do
To shift from access to outcomes, states and agencies need to strengthen the parts of the journey where drop-off is most likely:
- Guide residents through the journey, not just to a form. Redesign portals around personalized guidance that explains next steps, sets expectations, and shows the value of actions such as account creation.
- Use AI-assisted self-service to reduce friction. Deploy chat, guided support, and rich knowledge content to address common blockers. AI can extend workforce capacity and provide consistent, always-on support.
- Connect data, journeys, and transactions to drive completion. Invest in connected identity, data profiles, journey orchestration, and end-to-end transaction capability.
Case Study: Delivering Measurable Outcomes Through Connected Service Delivery
The impact of improving end-to-end service delivery is reflected in a state health benefits exchange. By streamlining communications, strengthening digital platforms, and using audience insights to improve user experience, the program delivered measurable outcomes at scale, including a 62% decline in uninsured residents over time. It also recorded a 64% increase in website traffic over three years, reaching 6.1 million page views per month.
These results highlight what stronger completion looks like in practice. When services are designed to guide users through to an outcome, rather than simply providing access, digital channels become a driver of real-world impact.
Fragmented Delivery Models Limit Consistency and Scale
Governments continue to invest in digital capabilities, but most service environments remain fragmented. Delivery is spread across multiple systems, platforms, and teams, with each component optimized in isolation rather than as part of a connected experience. Fragmentation shows up in both — how services are built and how they are experienced. Citizens move across multiple channels and processes to complete a single task, while states and agencies manage a growing number of tools, vendors, and integrations.
Digital Self-Service and Site Performance Comparison (2025 vs. 2026)
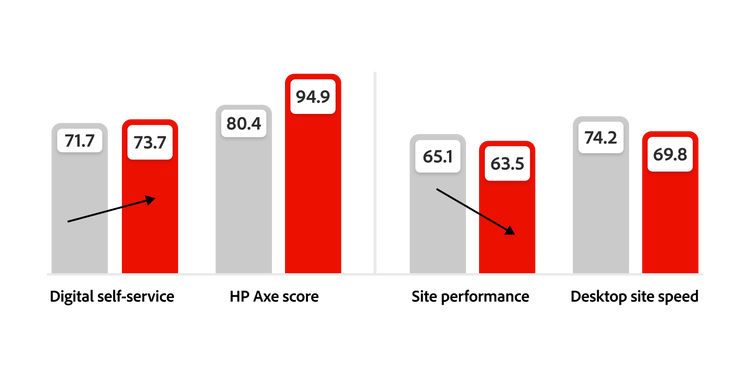
DGI data highlights the impacts and the trade-offs. Digital Self-Service improved by 2.2% year-on-year, lifted by accessibility improvements as states attempt to meet Department of Justice (DOJ) mandate deadlines. At the same time, Site Performance declined by 2.6%, driven primarily by slower desktop site speeds. This is noteworthy because it suggests that improvements are not coming from stronger technical performance, but from interventions layered on top of existing systems. Agencies are improving usability, accessibility, and interaction design, but often through additional tools or overlays rather than changes to the underlying platform.
A likely driver is the use of third-party add-ons to remediate accessibility or enhance experience features, improving compliance in the short term but introducing additional load that degrades performance. Experience moves at the surface level, at the cost of slower, less efficient technical delivery.
A similar pattern is visible in service executions, where agencies rely on manual or semi-digitized processes, particularly for document handling and form submission. Across state portals, none demonstrate strong digitized document workflows, and fewer than 10% of HHS agencies meet this threshold. When services are accessed online, users are often pushed back into offline steps such as using PDFs, re-uploads, or in-person verification.
These breakdowns create inefficiency while adding operational cost and complexity, leaving agencies to manage multiple vendors and solutions, duplicating functionality and increasing integration and maintenance overhead. Each new policy requirement or service change adds further pressure, requiring additional tools or reconfiguration rather than extending an existing capability.
What This Means
Fragmentation is no longer just a system issue. Citizens spend over 10 billion hours each year completing government paperwork5, while public sector workers lose more than five hours a week to manual processes6. Without a more cohesive model, further investment risks reinforcing complexity rather than resolving it.
What To Do
To move from fragmented delivery to coordinated experiences, agencies need to shift from point solutions to integrated systems.
- Consolidate platforms. Replace overlapping tools with integrated platforms that manage content, forms, data, and workflows together, reducing duplication and simplifying maintenance.
- Digitize workflows end-to-end. Replace PDFs and manual handoffs with connected forms, automated routing, and pre-populated data to reduce rework and improve completion speed.
- Align front-end experience with back-end operations. Website and interface improvements only translate into better outcomes when supported by connected data, identity, and workflow infrastructure.
Case Study: Cohesive Platforms Driving Scalable Outcomes
The State of Illinois’ digital modernization program shows how agencies can improve experience without performance trade-offs. Rather than adding accessibility or experience fixes onto a fragmented estate, Illinois consolidated 64 web properties into a unified platform, supported by shared tools for content, analytics, testing, and optimization.
Improvements were built into the operating model, not layered over it. A standardized platform made it easier to deploy content rapidly, personalize and update information in real time, and create clearer, more consistent communications across departments. As a result, Illinois strengthened accessibility and digital experience while also reducing operational complexity and protecting site performance. The broader lesson is that agencies are less likely to sacrifice speed for usability when they modernize the platform underneath the experience, rather than relying on add-ons to compensate for outdated systems.
The Anatomy of Best-in-Class Digital Government Service Delivery
No single state or agency currently excels across all DGI dimensions and capability measures that indicate leading and experience-driven public service delivery. Top performers across markets demonstrate how strong foundations, cross-government connectivity, and experience-enhancing capabilities can deliver better outcomes for citizens at scale.
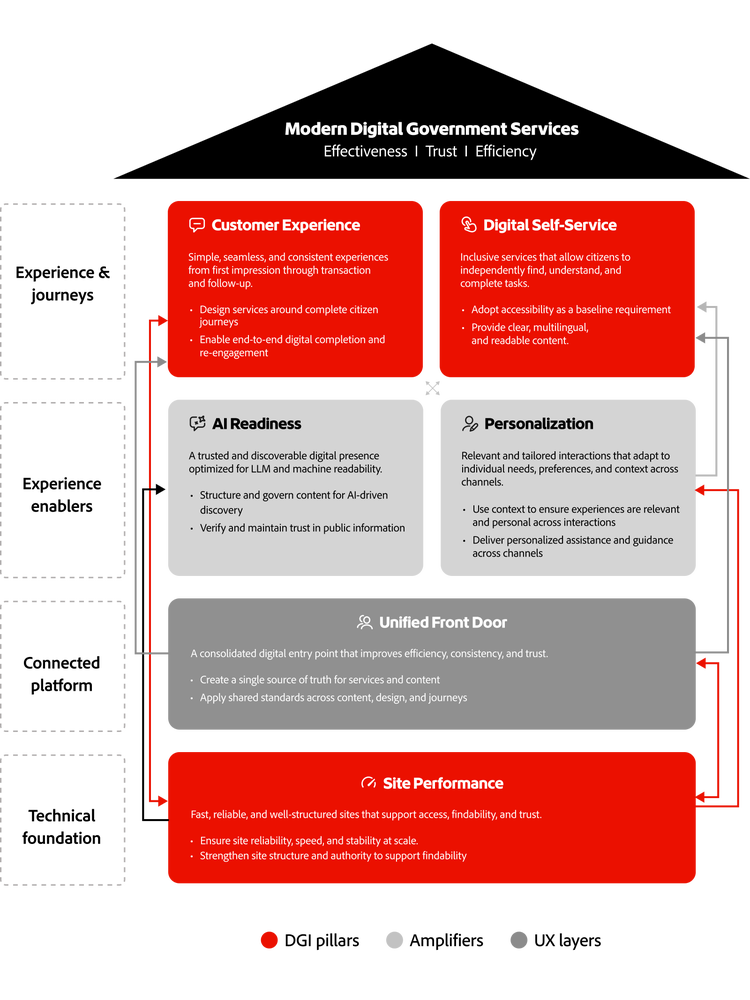
The Roadmap to Maturity and Higher DGI Scores
States and agencies can improve digital service delivery by building capability over time. While the destination is shared, different functions contribute in different ways. The roadmap below outlines how key roles can progress from foundational practices to scaled and optimized delivery.
CIO, CTO, and CDO
Responsibility for enterprise architecture, shared services, digital platforms, data, and cost to serve

Foundation

Scale

Optimize
Outcome
Deliver seamless constituent experiences through an integrated, AI-ready digital foundation.
Deliver seamless constituent experiences through an integrated, AI-ready digital foundation.
Audit digital performance, WCAG compliance, AI discoverability, and platform maturity.
Consolidate CMS and forms capabilities onto shared platforms.
Launch a unified digital ‘single front door’ for services.
DGI Signal
Fragmented platforms limit consistency, measurement, and AI discoverability.
Fragmented platforms limit consistency, measurement, and AI discoverability.
Identify duplicate CMS, forms, chatbot, and workflow platforms.
Establish HTML-first, accessibility, and structured content standards.
Centralize monitoring of performance, accessibility, SEO, AI discoverability, and user experience.
Priority Action
Audit platform portfolio and prioritize integration and shared digital capabilities.
Audit platform portfolio and prioritize integration and shared digital capabilities.
Quantify the volume of PDF-based services.
Stand up shared services for SSO, notifications, and workflows.
Shift funding from one-off projects to continuous digital service optimization.
Program and Service Owners
Responsible for applications, enrollment, service delivery, case management, and constituent outcomes
Foundation
Scale
Optimize
Outcome
Increase digital service completion and reduce friction across priority resident journeys.
Increase digital service completion and reduce friction across priority resident journeys.
Identify priority services still paper-based or manual.
Replace PDFs with digital forms that support completion, signature, and submission.
Automate intake and case routing.
DGI Signal
Residents evaluate digital services by how easily they can find, start, and complete high-value tasks.
Residents evaluate digital services by how easily they can find, start, and complete high-value tasks.
Measure abandonment, processing delays, and service bottlenecks.
Enable end-to-end digital workflows with no offline steps.
Integrate services across systems and agencies.
Priority Action
Identify drop-offs in priority service journeys and use personalization to increase completion.
Identify drop-offs in priority service journeys and use personalization to increase completion.
Quantify call-center and in-person demand..
Introduce eligibility screening early in the service journey.
Track completion rates and time to resolution as core metrics.
Accessibility, Compliance, and Communications
Responsible for WCAG compliance, readability, language access, content governance, and public trust
Foundation
Scale
Optimize
Outcome
Ensure equitable access to digital services while maintaining compliance.
Ensure equitable access to digital services while maintaining compliance.
Run a WCAG audit of priority pages and documents.
Remediate priority pages and documents for compliance.
Embed accessibility, compliance, and readability into publishing workflows.
DGI Signal
Compliance alone does not guarantee accessibility or usability.
Compliance alone does not guarantee accessibility or usability.
Identify readability, language, and accessibility gaps.
Convert high-traffic PDFs into accessible HTML experiences.
Scale multilingual and multi-format content delivery.
Priority Action
Supplement compliance testing with real user feedback to identify barriers.
Supplement compliance testing with real user feedback to identify barriers.
Flag high-risk services, including benefits and healthcare.
Rewrite priority content using plain language principles.
Use AI-assisted translation and readability tools with governance and human review.
What’s Next
Every year, Adobe’s DGI evaluation aims to deepen the understanding of how digital government services are evolving in the United States and internationally. While progress in building digital maturity continues at a steady pace, the most recent results reveal that delivering truly user-centric digital services remains a complex challenge and highlights an opportunity to offer more seamless, tailored, and consistent interactions across the entire citizen journey.
We partner with state government and HHS agencies to embed the index framework and strengthen ownership across the citizen journey. By leveraging digital enablers, including Personalization capability and AI Readiness, we help build the digital maturity required to deliver services that meet citizen needs — today and in the future.
To understand how your benchmarking result compares and discuss specific opportunities, please contact Amita Prabhu at amprabhu@adobe.com for a preliminary discussion.
Methodology
Adobe's Digital Strategy Group conducted the U.S. analysis for the annual Digital Government Index in 2026. The analysis covered the official portals of 50 state governments. Each of the three foundational digital maturity dimensions was assigned a score between 0 and 100, with the average producing the overall DGI score.
- Customer Experience: User testing was conducted with 960 residents, aged between 18 and 65 years, using a structured script to evaluate mobile and desktop experiences across 10 categories.
- Site Performance: Third-party tools, such as Google PageSpeed and Semrush, were employed to measure the cross-device speed, performance, and functionality of 50,000 pages across 50 state portals.
- Digital Self-Service: Manual analysis, supported by third-party tools such as Axe DevTools and Web FX, was undertaken to assess the accessibility and inclusion.
The team also analyzed two digital enablers using the following methods:
- Personalization: Conducted user testing on 50 state portals and 50 Health and Human Services websites to assess content relevance and consistency, personalized account dashboards, frictionless enrollment process, personalized registration and service emails, authenticated experiences, dynamic search, and self–service chat assistance.
- AI Readiness: Tested websites on nine metrics, including domain authority, source quality, AI visibility, crawlability, AI content visibility, brand recognition, AI search health, LLM referral traffic, and page load speed, using third-party tools, including Semrush, Similarweb, HubSpot, Google Trends, and Gushwork’s AI Search Grader.
SOURCES
1. Popular Chatbots Amplify Misinformation Axios (2025)
2. Gartner Predicts by 2028, 50% Of Organizations Will Adopt Zero-Trust Data Governance as Unverified AI-Generated Data Grows (2026)
3. Reimagining Public Services in the Age of AI. Accenture (2025)
4. Understanding Citizen Expectations: How Private Sector Customer Experiences Fuel Innovation in Local Government. Springbrook Software.
5. Building Digital Experiences for the American People. The White House (2023).
6. New Data Shows UK Public Sector Burdened with 30.6 Million Hours of Extra Work Every Week (2025)
2. Gartner Predicts by 2028, 50% Of Organizations Will Adopt Zero-Trust Data Governance as Unverified AI-Generated Data Grows (2026)
3. Reimagining Public Services in the Age of AI. Accenture (2025)
4. Understanding Citizen Expectations: How Private Sector Customer Experiences Fuel Innovation in Local Government. Springbrook Software.
5. Building Digital Experiences for the American People. The White House (2023).
6. New Data Shows UK Public Sector Burdened with 30.6 Million Hours of Extra Work Every Week (2025)
Title
Insights from the Digital Government Index.
cardDate
2026-09-29
cardImage
CardDescription
Adobe report reveals progress, gaps and interconnected factors that are shaping the US’s digital governance.
primaryTag
caas:content-type/report
Tags
caas:content-type/report, caas:industry/government