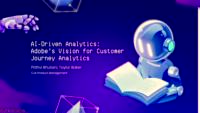
[Music] [Prithvi Bhutani] Good morning.
Wow. Thank you. Good morning.
All right. 9am session on day three of the Summit. I deeply appreciate all of you all being here, especially after the Bash last night. Thank you so much for making it. AI-Driven Analytics that is our session today. We are so excited to be getting into it.
Let's begin. Once doors close.
All right. I'm Prithvi Bhutani. I lead product management in CJA, Customer Journey Analytics. My focus is AI/ML in CJA as well as Content Analytics. I am super excited to be talking about some of the features here today. [Taylor Baker] Thank you. And to reiterate what Prithvi said, thank you all so much for being here. I see some of you wearing the gaming T-shirt from Trevor Paulsen's session. We'll try to make it close to as exciting as that. We don't have video games, and I don't have the hat that was custom programmed with the Adobe logo going across it but we'll try our best. So I'm Taylor. I've been at Adobe for two years, and I'm focused on GenAI Initiatives. So I want to kick it off with a couple of quick facts about us. One is, so the interesting fact that I typically share, I broke my nose mountain biking the day before wedding engagement photos.
My wife, my fiancée at the time, luckily, she ended up marrying me, encouraged me not to go, and then I went and went on an advanced trail, and anyway, ended up with a broken nose that I'm still managing. But anyway, Prithvi. Oh, strange fact more than a fun fact, I think.
I enjoy the rain, and I'm not a big fan of sun and summer, so I moved to Seattle.
I love it there. I don't know if anyone from Seattle here? There we go. Oh, my god! - Nice. - Awesome. Nice. Yeah. So yeah, I moved to Seattle, and I love it.
- All right. - Okay.
Okay. Again, thank you all for being here. Let's kick it off with a really quick poll. If you guys can open up your phones, most of you look like you might already have it out, scan this QR code, and then what we really want to know is which GenAI tools you're using consistently, and to be clear, we don't mean at work. I know the whole point of Summit has been what's happening at work, what's Adobe doing at work, what are you guys doing with Adobe at work. But we want to know, just GenAI in general, how are you using Generative AI day-to-day at home or in your life? One example, my daughter is seven, and she loves unicorns, and she also likes dragons, and she likes to have me generate images that combine them into one. Sometimes they look amazing, sometimes they look super strange but that's one example of how I use it in my day-to-day life. What are you guys building, side projects with cursor? Are you using AI for other things we'd love to see? - We switch over? - Yeah, three. [Man] The QR code doesn't work, I guess, but the quick link does. Okay. - The QR code. - Do you guys still need the QR code? This QR code should work.
No. This one. This one. This one. I just didn't know if they still needed the code. - They're up top. - Okay. Yeah.
Nice. Nice. ChatGPT winning.
Perplexity, coding, Firefly, learning. Okay.
Cooking and meal making. I like that. Grok.
This is very cool. Very interesting.
Brainstorming.
Okay. Cool.
All right. Thank you for sharing that. Okay. So let's kick it off with understanding how we approach GenAI in CJA. We want to give you a little bit of insight into our strategy. Generative AI has been an especially hot topic for the last few years but CJA, we've actually been building GenAI tools in CJA for quite a while before all of this GenAI focus in the world. Our strategy in CJA is to use GenAI to surface insights when needed to empower different user personas to confidently engage with data and more quickly become data experts. Essentially, we want GenAI to help a wide range of users of CJA to be able to do their jobs better and more efficiently, and also for a wider range of users to be able to have access to data analytics and feel comfortable asking data questions. So a lot of the features that we'll be walking through today showcase those capabilities of helping a wider range of users use GenAI and use analytics, in their day-to-day lives and feel empowered.
Okay.
Okay. So Customer Journey Analytics offers a range of capabilities that scale in intelligence as well as automation. Right? So today, we'll be placing those features on what we like to call an agentic scale. The features will progress from foundational capabilities to more advanced AI-powered intelligence. The idea is to support different levels of journey analysis as well as decision-making. So first level is the human level. We do see that this is a more foundational level, and we have features designed to help analysts surface insights, test hypotheses efficiently. Now these tools do provide valuable insights but require a significant amount of interaction as well as interpretation of the data. As we move up to the cybernetic level, we're moving up the scale, and we're introducing more intelligent features that we like to see as more of an extension of you as the user. And they enhance analysis with automation as well as predictive capabilities. The features work alongside you. They're working with you, accelerating understanding of the data, as well as helping with forward-looking insights.
The next and the highest level on the scale today is the cyborg level, where we think this is a true mind meld between you and an agentic capability.
We see the emergence of more autonomous AI-powered capabilities that can drive action, goal-driven action and automation specifically, in insight generation as well as supporting any kind of decision-making that you may need. Each of these features does represent a step forward in making CJA more intuitive, efficient, and work for you, empowering your teams and you to be able to work efficiently.
So first up, we will be talking about the human level. We'll talk about each of the features and we'll show you a quick demo as well. Just as a quick reminder, these features are available already in Customer Journey Analytics, so you can try them out today after the session. So we'll touch on Anomaly Detection, Algorithmic Attribution, and the Experimentation Panel. Anomaly detection, as the name implies, it just allows you to be able to separate true signals from noise. In other words, it'll let you identify any kind of statistical fluctuations in your data and help highlight that for you. So let's say it's a Monday morning, you get into work, and you're starting to look at your weekly dashboards. Right? You notice a sudden dip in your revenue, and you got to figure out what's happening before you get into a status meeting. What you might do is start to mine through all the revenue numbers, look at it pre-campaign, post-campaign, do a quick comparison, try to see if it is statistically significant, and then arrive at a conclusion.
Just explaining the process is taking a significant amount of time, so just imagine having to actually do that manually. And that's where anomaly detection comes in. Right? In a matter of seconds, you can do all of that. It quickly looks at a historical window and identifies any anomalies for you within a table or a visualization. All of the anomalies are detected in relation with a previous data point, so it identifies any radical changes in your data.
Some quick tips and tricks, as you look to use them, you can quickly spot anomalies in a line viz. So even if you do have a table, just if you visualize that in a line chart, anomalies are more obvious and visible with the little dots. You'll see that in the demo. And you can leverage anomaly detection over API too. So if you're not a UI analysis Workspace UI user, feel free to leverage that capability over API.
Attribution. We all understand that true experimentation is the gold standard in identifying any kind of causality. So as such, attribution has really been a challenge for marketers and analysts. Now traditional models like First-Touch or Last-Touch would provide a fixed approach but they don't always reflect the real impact of each touch point. So this is where algorithmic attribution in Customer Journey Analytics becomes a bit of a game-changer. So unlike rules-based attribution, this uses statistical techniques to look at the optimal allocation, so credit is allocated to different touch points relating to that conversion metric. So it's looking at historical patterns and analyzing how those different touch points have interacted in the past to be able to allocate credit in the now. So let's say a user interacts with three channels before actually converting. Right? So they click a paid search ad, they click on an email campaign, and then they click on a social media ad. At Last-Touch, the social media ad is going to get 100% of the allocation. With algorithmic attribution, it would work a little bit differently. What we would do is look at the historical data, and in this case maybe that shows that users that engage with the email channel actually convert more. So given that, the model may allocate 40% of the credit to email, 35% to social media, and 25% to paid search. So it's allocating based on historical performance of these channels. So this helps you understand what's really driving performance, and eliminating any of the guesswork that might normally be there. So some tips and tricks again. If your dimension has just a single dimension item, irrespective of what attribution method you use, all of it will be allocated to that single attribution item. So for attribution, generally, just pick a dimension that has multiple touch points.
If you need a metric with multiple attribution settings, for some reason you want to be able to compare for the same metric and different attribution settings, you can create copies of the metric in the Data View and assign different attribution settings for them, or in real time, in Analysis Workspace, you can swap the setting for each of them and do a comparison of what First-Touch would do versus Last-Touch versus algorithmic. So that's a quick check that you can do as well. Moving on, experimentation panels. We talked about the gold standard being experimentation, so making informed decisions about customer experience becomes really crucial. Driving engagement, any type of conversions, and retention. So experimentation in CJA enables you to measure different experiences and activities, helping you determine what truly works. So this is a statistical way to identify which of your variants truly are driving the outcome that you're looking for. So it could be different messaging, different layouts, different workflows, different content. You could be testing, any of those. As long as there's a control and a variant, you will be able to identify what's driving higher conversions or improved customer satisfaction. So let's take an example of a hotel brand, and they're testing two different checkout flows. Right? One with a guest checkout option and another one that requires an actual account creation and a login to do the checkout. So they want to get a sense of which one performs best because the default today is requiring a login. So by using experimentation in CJA, they can measure which experience is driving a higher completion, after they run the experiment. So if the guest checkout option actually drives higher conversion, they would be able to optimize and say, "Okay, let's actually build these two workflows and have that be available for all users." So some tips here. You can filter audiences. You can filter the entire panel by specific audience or segment that you have pre-built. Just apply the segment before you run the panel so all the data is filtered out and lift and confidence is calculated on top of that. You can also use our advanced calculator metric functions. So we have lift and confidence functions available in the Calculated Metric Builder. So you can actually create your custom lift and confidence metrics and use it in any customized Freeform table that you may have. So try that out. Let's take a look at what all of this looks like coming together in a demo.
Okay. So let's jump into this demo. We'll kick it off with anomaly detection. Thank you, Prithvi, for walking through those. Let's jump in here to this line viz. So we can see in this panel that we're looking at session's data, and we're looking from December 2024 to the end of February. All these little dots on the line, we start to notice, we're like "What do those mean?" These are anomalies, and these fall outside of the expected range of standard deviations, and it looks like here on February 27 that we had an anomaly that our sessions were 73% below expected. So when you're reviewing your website you notice that session's data has fallen. There's these little dots. It tells you exactly how far away from expected that anomaly is. It uses a statistical method like Prithvi highlighted to determine how a given metric has changed in relation to prior data and prior trends, allowing you to separate true signals from noise, and then identify factors that contributed to those anomalies. So here, again, we noticed that there was this anomaly in sessions. We can see that both in the line viz here with these dots but we can also see that in the Freeform table. So these little indicators here indicate that there were anomalies. If I click on one of them, I can see 66% below expected. We can scroll through but you can see it in both. And one of the nice things about anomaly detection, I'm going to-- Sorry. Click here again so we can see everything, is that you can turn on and off these anomalies in settings. So you can show them if you want, you can hide them, you can show them in the viz but then not in the column, and hide them in the column. So you have a lot of flexibility in terms of how you want to display your data and which data you want to rely on. Okay. Let's move on to algorithmic attribution. I think Prithvi did a really good job of explaining what algorithmic attribution is but just to go through briefly one more time, attribution models are used in analytics to determine which customer interactions get credit for conversion. So if your users are making a purchase or order or sign up, whatever that flow looks like but in our example today, we're going to be looking at orders.
So given that we're trying to focus on this conversion metric of orders, here we're evaluating a couple of different models. One is Last-Touch, and one is algorithmic. And I'll start to talk you through and show you some of the differences between the two. So again, to reiterate what is algorithmic attribution, looking first at Last-Touch and First-Touch. First-Touch is when the first interaction that a customer has on this customer journey gets 100% of the credit for the conversion, and then Last-Touch is when the last action in the journey gets 100% of the credit. Algorithmic attribution spreads up the credit across the customer journey. So I think you get a much more accurate and better picture of what that customer journey looks like, and we can see that here in these two columns. So for total orders, when we look at Last-Touch, email here got 68,000 total orders but text, the very bottom one, had zero orders. So there was this gap between the highest and lowest of 68,000. That's pretty high variation. But when we look at algorithmic, which is spreading up that attribution across the journey, we can see that email received only 38,000 total orders. So if we were looking at Last-Touch, we're over accounting for the fact that email is driving a lot of conversions, when in reality, when we use algorithmic attribution, we can start to see that some of these other marketing channels are also really helping drive attribution and drive conversion at pretty similar rates. Email is really similar to display but in this case, it looks like email is a big win over display.
And again, you can see the percent change here, so we can see at the top of the funnel, or at the top of the marketing channels that emails 43% lower total for algorithmic attribution, whereas at the bottom of this with text or with television, we're seeing much higher conversion that's being attributed to television, etcetera. Okay. So let's move through to the next one, experimentation panel.
Experimentation panel lets analysts compare different user experiences, marketing or messaging versions, etcetera, to determine what might be driving a specific outcome. So in this example, we can see with the experimentation panel that we've already input our experiment that we wanted to use. We already decided that our control variant should be no offers, and we already decided that our success metrics should be total orders, again, to follow the same pattern from the prior panel. So looking at experimentation panel, we can see that of these variants that exist, the 20% discount offer is having a much higher impact on conversion than the double points offer that we're offering. So we're evaluating a bunch of these different marketing campaigns and looking at which one is the most successful. That was our experiment that we're trying to figure out. Experimentation Panel also shows us that this experiment was conclusive. We see a massive lift between the 20% discount offer and the double points offer, and we know that with extremely high confidence that that variant is the best one to pursue in our experiment. So this experimentation panel helps us see exactly where to put our marketing dollars and our other investments throughout these different experiments.
Okay.
Okay. So let me thank you for letting me take you through that demo. Let's move on next to our cybernetic features in CJA, intelligent captions and forecasting. So as Prithvi mentioned, the cybernetic features are more intelligent features that enhance analysis further with AI-driven automation and predictive capabilities. Cybernetic features assist in interpreting data and forecasting outcomes. These features work alongside users, accelerating understanding and providing forward looking insight.
So these cybernetic features actually have already been deployed, have already been released, the most recent being the intelligent captions enhancements that were released just a couple of months ago. Some of you who are already in CJA may have already noticed some of those changes but I'll walk you through what those enhancements were to intelligent captions.
We'll first jump in with intelligent captions, which provides users with quick and helpful insights and takeaways for a variety of different visualization types, and then we'll walk through forecasting, which helps users predict where their data is likely to head based on past trends, and I'll do a demo of each of these to walk through them in more detail. So let's jump in first with intelligent captions. I'm really excited about this. I'm excited about the-- We are excited about the enhancements that we made to intelligent captions just a few months ago, which we'll walk through today. So at a high level, intelligent captions uses Generative AI to provide natural language insights and trends and takeaways for various Workspace visualizations. So you can see in this example here, the captions are generated at the bottom, and we'll all, again, do a demo to kind of show you how that works but it's very easy on the user side. All they need to do is click a little captions button, and then automated insights are added to the bottom of the visualization. Those insights are dynamic, so if a user goes in and changes the date range or if you refresh the project from the next day, the captions on the entire project that were there before are automatically updated, and you can share those insights out to different stakeholders within your business.
As far as general enhancements that we made to intelligent captions in general...
The first version of intelligent captions released in 2023, and the first version of intelligent captions supported one metric and the line viz. So only one visualization. It's the most used visualization in Workspace. We wanted to test out the hypothesis that there was a big impact there, and we received really positive feedback from customers, so then, made much more of an investment into intelligent captions and further enhanced it to expand the caption support to a lot more visualization types within Workspace. And there are also some enhancements that we'll walk through today to the user interface.
I'll show some of these in the demo but some tips and tricks to be aware of before we jump in are that with intelligent captions and these newer enhancements that we've released, you can see correlation between multiple metrics as one of the caption types. So you can add in multiple metrics to the line visualization and then generate captions and see exactly what the relationship is between these different metrics that you're adding to the line viz. You can also get weekly insights on intelligent captions, really easily through scheduled reports, so you can schedule out these PDFs and send them to different stakeholders within your business, and you can edit these captions to only show what you want to show. So if there were four insights generated for a specific caption, you could hide two of them if you only felt like one or two were really highly relevant to your business, or the other two were consistently happening over time.
Okay. Next is Time Series Forecasting. You may be familiar with this one after using Adobe Analytics and CJA. Forecasting uses predictive analytics to pick the appropriate algorithm and forecast any metric in line, and this includes calculated metrics, calculated components. You can see the forecast easily on both the line visualization and in the Freeform table, just like with anomaly detection, and you have the flexibility, just like with anomaly detection, to show or hide that forecast, both in the Freeform table and in the line viz.
Forecasting, the largest benefit is that you can use it for planning, for risk management, for benchmarking, and for a lot more.
Some quick tips and tricks, you really need to ensure that there's enough historical data to do these forecasts, and the model just won't show the forecast if you don't have enough data in it. If you have a higher granularity, like if you use granularity by day instead of by week, then you'll have a lot more data points for the model to forecast off of. But if you chose the week granularity or the month granularity and only did that across a couple of months, there may not be enough data points to run that forecast, so just make sure that you have enough data points to be running these forecasts.
And then second, you can also use forecasting to forecast not only built-in metrics but also calculated metrics, like return on ad spend, whatever kind of metrics you are building and calculating in CJA.
All right. Let's jump into a demo to walk through these. So again, we're looking at this viz, and we switched out the metric for share project instead but here we can easily see from December to March, the month of March has not yet completed. We can see what the forecast looks like for March, so we know that we're expecting on March 29 that we'll see 668 share project actions, and we can see the seasonality by week, over time, and that seasonality mirrored in this forecast as well. In the settings, you can go in and again, turn on and off that forecast if you want to show it. In the Freeform table, you can also adjust that. I know I reduced-- I hid that Freeform table but if we expand down here, we can see down in March these forecasts. So these little dotted lines on the Freeform table show that forecast so that in whichever way you're looking at your data, if you want to look at it just in the Freeform table or just in the line visualization, you can see those forecasts and quickly act on them.
Jumping into intelligent captions, we can actually just show you a demonstration of intelligent captions using this line viz. So we already have this share project data, and all I need to do is click this captions button, very quick and easy. It's generating these natural language insights, and we'll see that in just a second. We have some really relevant insights about share project. So one of the ones that I highlighted just previously about the seasonality is highlighted right here, seasonality. So every seven days, there's a cyclical pattern in share project actions, with the highest number occurring on day three and the lowest on day seven. So it gave me some more insights into seasonality that I hadn't specifically pulled out of the visualization. The minimum value, the maximum value, what's the trend look like, where's the highest spike, where's the lowest decline. And what's exciting about intelligent captions is that as you change these time ranges, as you change the metrics and components that are in your Freeform table, the captions automatically update and give you relevant insights. And captions are also tailored to the specific visualization type that you're using. With the latest enhancements that we made, we expanded it not from only the line viz but also we added flow and fallout and donut and bar and all these additional visualizations that people were super excited about and requesting. When the first version was released, one of the first questions was how do we expand this to more and even with the second one, it's like how do we expand it to everything, even though we're covering the most used visualizations in Workspace.
Quickly walking through some of the enhancements to the user interface, with the first version of intelligent captions, one of the things that people loved most was the ability to share these insights out. We wanted to give users more flexibility with this latest enhancement to be able to share those out but in a more tailored way. So with the second version, you can continue to be able to edit the visualizations, the captions that you want to show, so here I'm hiding minimum value, maximum value, which maybe aren't as relevant to me and my business. And if I hide those in the grouped view, I can then also-- They're hidden in this one by one view. So this one by one view is one of the newer features as well in intelligent captions that you can look at insights and only focus on what you find to be most relevant to your business, and again reduce screen real estate to not take up all of those, all of that room with the expanded view of intelligent captions.
And then finally, with the expanded and contracted or minimized view, you can copy and share out all those captions at once, like in this grouped view, or you can, in the one by one view, copy only one at a time.
Okay. Let's move on and see some of these other captions, some of these other visualization types that we're supporting. So here's multiline. With the first version of intelligent captions, we were only supporting one metric on a single line viz. Here, we can see that we're supporting multiple metrics in the line viz. So here we added events and sessions, and we're seeing some captions. Actually, I think I might have hidden some earlier. Here we go. We're seeing some captions related to both, so we can see correlation between the two in this demo data. They're extremely highly correlated because they were generated in a similar way by our team but we can start to see how those insights are really relevant to our business and we can take quick action on them. I can share these out to my team and better understand how these two metrics or calculated metrics are related to each other. Area supports single line as well as multiline, and then bar, where we can see both with-- Here we can start to see some of the different captions that are showing up. Again, like I mentioned earlier, we tailor them by viz type.
Our team and Adobe has tried to work on making these as impactful as possible for each specific viz type and to tailor those captions to each viz type. So here we can see minimum value skewness, where these bars skewed towards-- Where is the data skewed towards, which are the highest bars, and then top two delta. Top two delta is what's the difference between the highest bar and the second highest bar.
Horizontal bar has some similar captions. Donuts here, we can also see min value, highest bars, top two delta, and again, all very, very easy to generate. All you need to do is click on this captions button, and we have some really relevant insights to our business. And then lastly, fallout and flow, which were two of the most requested visualizations to support for intelligent captions. Here, as we're looking at this customer journey from page load to save project, and all these actions that our users are taking in Workspace or in our app on our website. We can see the maximum fallout happened between drag drop components and that 78% percent of people were failing to reach ad visualization, eventually. And then the maximum conversion happened between ad visualization and saved project.
And then lastly, flow. So here, this is a very straightforward example of days of the week and where is the data flowing, and luckily we're starting to see that flow is definitely validating the fact that Monday is before Tuesday. But the day is that, this data is flowing as expected, which is great. Great to see that our demo data is also following the actual days of the week. But top receiving flow, top subsequent flow, top preceding nodes, top subsequent nodes, flow is typically a lot more variable than this demo data here but all of that insight is generated super quickly, and you can share out these insights. Flow and fallout, I think, in particular, are harder visualizations to analyze for a less experienced analyst, and for them to be able to just click on that intelligent captions button and then share out those valuable insights is really, really huge.
Thank you, Taylor.
So this data just, that Taylor's been showing, if you couldn't tell, that's a little bit of analytics and analytics. It's how we monitor usage of our product, so you can see how people are actually clicking on ad visualization or not. So that's just a bit of a fun little data set that we have. Moving on with our transformation. So we talked about different levels on the scale. We covered the foundational level, the human level. We moved on to become cybernetic in nature. And now we are going to talk about the cyborg section. So that's the highest level on our agentic scale. Here, we do see our users being empowered with the power of agents, and these capabilities are a lot more autonomous, and they work hand in hand in partnership with you, the user, to be more efficient. So here's a snapshot of the different agents that we will discuss today. So we see agents truly as a force multiplier in your different touch points, working with you to empower you with data management or measurement and reporting and analytics. Each of these agents are goal-driven. They do drive action or automation, and they have pretty advanced reasoning capabilities. Now agents also internally have different skills. Each agent has a host of skills that they work on and that they perform actions on your behalf, on your users' behalf, depending on what you need to do in CJA. On the left here, you see what's our data insights agent which is coming soon, you can see the list of skills that we are working on building towards. And then on the right, you see two of the newer agents that we are working on as well, and we'll cover each of them. So just as a reminder, these are capabilities that are still being built out, and they're on our road map. We are really excited to be able to give you a sneak preview into it. Thanks.
Okay. Let me share an experience that may seem familiar to many of you. In a prior career, I was a data analyst at a B2B SaaS startup, and I was one of 10 experts in our data analytics software. My core objective as a data analyst when I was hired was to identify novel insights in the data and then recommend next steps and strategy changes to our executive leadership. That's what I was ostensibly supposed to spend 100% of my time on was looking at our data, figuring out really interesting insights to drive the business forward, and then sharing those with executives. But what I ended up spending a fair amount of time on, unfortunately one to three hours a day, depending on the week, was answering questions for people who had less experience in data analytics and had frankly, fairly basic questions, like what was my revenue last month in this specific-- Like, what were sales in this very specific area of the United States? Or for marketing campaign X, what did our conversion rate look like? And if they had the ability to just go in and use this data analytics tool or learn how to use it, they would've been able to self-serve, find those analytics on their own, and feel empowered to drive the business forward. But unfortunately, they felt overwhelmed by the analytics UI, they felt overwhelmed by the data that we had in the user interface, and so instead, they came to me, and our team ended up spending a lot of time finding these insights. And we're hearing that same story from all of you, from talking to our customers. You have a really complex organization that has a lot of complex data but there are a lot of users at your companies who have these data questions and they want to be able to go into the data analytics software and ask them themselves or figure out where to go. Instead of just consuming the data, they want to be able to create and explore. But right now, they feel like they really can only consume, whether that's an organizational thing or because of the analytics software. So this is a story we keep on hearing from users, and in order to address that, we're building the data insights agent in CJA. With the data insights agent, users can ask questions in natural language, typing a sentence like, "What were our orders last week in California?" The data insights agent scans through your data view, builds a data visualization and Freeform table to quickly answer that question, saving your users' time, simplifying insight discovery, and empowering more users within your organizations to self-serve their analytics. So after we share a few more ideas, I'll take you through a live demo of this data insights agent, which is the latest version of the model that we're working through right now. We're moving into limited beta with customers right after Summit but we'll show you the latest version of the data insights agent today. But to tee that up, let me tell you a couple of tips and tricks about the data insights agent. In addition to being able to build new visualizations in Workspace, as you can see in this demo here, you can also use the data insights agent to update the visualizations that you've built, so it's not only allowing users to go in and build entire projects or build panels, build analyses, they can also use text prompts to update the visualizations that they've already built. You could use a prompt to update, like change the date range to last month or add a metric as a column or whatever that might look like. You have a lot of flexibility with that update functionality. Additionally, if users ask generic questions, as you know, there's a lot of metrics sometimes in your data views or your data sets that sound similar, like revenue or product cost, order cost, and all of those metrics have their own use cases. Sometimes they may be duplicates, and we have features for that to help with reducing those duplicates but there are often these metrics that are really similar, and if a user just asks a generic question like, "Help me with my order cost," we can look through and the agent looks and basically surfaces those that are similar and says, "Here are three similar metrics. Which of these did you mean?" And then your user can select that and better ensure that your users find the correct metric.
Okay. Let's move on to data summarizer. So we demoed intelligent captions earlier, and you got to see the power of Generative AI in summarizing insights from frequently used visualizations in Workspace. But data summarizer takes things forward, summarizing insights not only across single visualizations but across entire panels of visualizations, so it gives you these insights across, in a panel, you might have a line viz, a bar viz, a flow viz, and a fall out viz. It summarizes the captions of the insights across all of those visualizations and then puts them into a really helpful text box at the top with these text insights. And your users not only have the ability to copy and share out these insights, they can also go in and edit them, and add additional business context if needed, which might not be in the system, or edit it as they please and only show what they feel like is the most valuable for their business and for their storytelling as they share it out to their executive stakeholders. But this data summarizer saves data analysts, like I was in a prior life, a lot of time in that they can have these insights a lot faster, especially since frequently data analysts are spending a lot of their time getting the same kinds of insights and summarizing those same kinds of insights every week. So this this pulls out to the top really quickly.
Okay. So speaking of additional business context and pulling that into your projects, let me present Brand Brain. This may look familiar if you were at Snyk's. A version of this was presented there. Brand Brain helps your users not only understand the 'what' of what's happening in your data but also the 'why'. CJA users perform really complex, remarkably detailed analyses in CJA but the business context for why data is trending a certain direction is often siloed within your business or only specific data analysts have the context that they need to be able to surface that. Brand Brain helps users and organizations bring exogenous or other contextual data into your company's business into CJA. So examples of this data might include public data like the consumer price index or CPI or internal trusted data, like site updates, goals, objectives, or even if you were researching competitors, what their competitive movements might look like, whether those are public competitive movements or if your users are just looking at demos of your competitors and you start to notice these other competitive movements, and you bring that data and context into Brand Brain. This context is brought into Brand Brain where users will have control over the weights that are assigned to these different categories. So you can see these different categories here. There's experience data, and there's external data, and there's weather data and all these things. Users have the flexibility to change this weighting model to weight towards what your users or your company thinks is the most valuable to your business, and you can adjust that weighting model. And then all of this context, once it's in Brand Brain, is surfaced as recommendations in Workspace. So when you're in Workspace, not only do tools like intelligent captions surface the 'what' of what's happening in the beta, in the data but it can also start to surface some of the 'why', recognizing that this context is now, in the system and not siloed across the business.
Thank you, Taylor. So all the capabilities that we saw so far in the cybernetic scale are what we call skills of the data insights agent. We will see some of those skills today, not all but we want to move on to the two newer agents that I talked about. So this is not about data insights anymore. We're talking schema design. Anyone's tried to do that task recently? No. I see some-- Yeah. Anyone thought that was super fun? Easy. Oh, there we go. Thank you. All right. So we have an agent that we're looking to build to help out on that. So defining the right data schema is a very complex manual process. It does require a deep knowledge of what the schema is, what the data that you're bringing in, event models, as well as field groups and such. Now the agent makes that a whole lot easier by automating and simplifying the design of the schema and generating an optimized version. So it can accept different kinds of inputs. So it can accept a natural language input where you can give it instructions, you can give it examples, you can add some context as well. And if you have data examples, you can upload CSV and JSON as well. It processes all of that input, the structured and the unstructured parts of it, and it will identify key fields. It'll assign appropriate data types and basically structure the schema based on some Adobe best practices. So by leveraging AI-powered pattern recognition as well as large language model, it leverages industry best practices as well. So this will ensure that the schemas are well structured, they are scalable, and immediately usable.
And the next agent capability that we want to talk about is incrementality. Incrementality is a huge topic in a lot of organizations. Everyone does want to understand the investment in customer experience that goes on, so it's not just about knowing what happened. It's about the understanding why and what level of outcome did it actually drive. So the incrementality agent in CJA is designed to be able to answer these questions by helping teams identify the true impact of any marketing event or action that may have happened in your user journey. So it analyzes different journey paths and identifies what's actually leading to conversions. It does have a structured approach, so there's three key things that it does. Identification, so it does pinpoint converting and non-converting paths, helping you see which journeys are leading to success and where really the drop-offs are occurring. Root cause analysis is done then to understand what's actually driving the conversion and maybe what's not driving the conversion as well. And then finally, recommendation. Providing actionable next steps to move the customers from a non-converting path to a converting path. So that way you're optimizing each of your journey paths in your digital interfaces. So instead of relying on assumptions or Last-Touch attribution, the agent can enable teams to make data backed-decisions about where to focus any optimization efforts. So understanding the journey paths will drive value, and then you also identify what's actually causing friction and try to eliminate that as you build some of those personalization.
Okay. So we're going to go into a section where we're going to be talking about the data insights agent. So let's go back to the data insights agent. We're going to go and do some decoding. We're going to see a demo, and then we'll also walk you through a little bit of what's happening under the hood for each of the steps of the data insights agent. Yep.
Okay. So today, I will be playing the role of a marketer who is trying to explore some of my data for the first time. Previously, I relied on data analysts in my company to answer my data questions but with the release of the data insights agent, I can now build analyses and answer those questions on my own. So where is this data insights agent and how do we access this? So jumping into this Cyborg demo or this new blank Workspace project, all users need to do is click on this chat icon here. And once they click on that chat icon, they then have those capabilities, assuming they're enabled in the admin console and those permissions are set up by their company, they can jump in here and start to type a text prompt. So if I'm curious about understanding my purchases that I received last October, all I need to type is show purchases last October.
But before I run this through-- You have to wait with bated breath. But before I run this through, I'm going to hand it off to Prithvi to explain what happens while it's being run, and then I'm going to run it and show you what it looks like. Thank you. So the first step in the data insight agent is understanding that prompt. Right? So Taylor typed out what are my purchases in last October. So we're translating that natural language prompt into a very precise data query. So this step is very critical because it ensures that the agent can understand what the user is asking for, the intent of the user, and just the right context around it.
When a prompt is entered, several key things are happening behind the scenes. So some of them, first up is access. So the agent is determining users' access levels. Do you have access to the right datasets? Do you have access to the assistant capabilities? Any other enterprise guardrails that may be in place. Next is intent. The agent identifies what intent is this user coming in with? Is it analysis? Do they want a summary? Are they looking to identify anomalies? It's important for the agent to be able to determine specifically what the user is coming in with, and that's done with the first entry of that natural language prompt. Next is context. It's important to understand where in Analysis Workspace the user may be, what else they have on their canvas already. So that way we can ensure that the agent is responding accurately to whatever context is already present in front of the user. And then lastly, it is multi-turn. So it's looking at all the previous prompts and it's trying to figure out if this is one prompt out of a conversation or it is a prompt on its own, just an isolated one. So it's important to be able to identify that so the agent can stitch conversations or prompts together into an actual conversation. There are several technologies under the hood that do power this. First, obviously, are the enterprise guardrails that we have in place. So it's built-in governance to ensure we are in compliance with any data policies that you may have, security rules, user permissions, what kind of data is sent to the LLM and not. There's no cross training across different customers, things like that. Large language model is leveraged here as well. The agent leverages a large language model to interpret the natural language query. And then lastly, proprietary models that Adobe has built. So it's our own model that helps us understand specific pieces of the prompt and translate that into data in the system. And that does incorporate a lot of domain-specific knowledge as well as Customer Journey Analytics expertise that we have.
Okay. So let's actually run this and see what happens, see the value of the data insights agent. So all I do is press Enter, show purchases last October, and the data insights agent looks through all of the data in My Data View. And it includes the different types of metrics and components, make sure that it's matching in the right ones, and then brings those in. And it translates that prompt to pick out the right dimension, metric, and date range for this analysis. So here in this case, it shows the line visualization to address this show purchases last October. It shows last October, October 2021 to October 2024. And then it built this Freeform table where it broke it down with the data dimension and selected the purchases metric, and it did all of that in just a few seconds. So I'm going to toss it off to Prithvi now, to explain what happens when we're querying data, and then I'll show a few more advanced prompts.
So once the data insights agent understands the user's request through the previous prompt comprehension, the next step is obviously querying the data. Right? So where we're translating all of that intent, that natural language prompt, into a query that actually goes into your data view and pulls out the right data. So at this stage, several processes are happening. So one is grounding. The agent has to ensure that it is aligning with the underlying data in CJA. That minimizes hallucinations. Second is the actual CJA data query that happens. So this is an optimized query that pulls specifically just the parts that we need to be able to show in that Workspace canvas. The third piece is a viz recommendation. Depending on the data that was returned, the granularity of the data, the number of data points that was returned, and what kind of data it is, we have models that will actually recommend a visualization for you. So as Taylor goes through his demos, you'll see different prompts actually generate different types of visualizations, and that's because, again, the granularity of the data and the data returned. Under the hood, we do use a knowledge base, which essentially is a data repository. It contains business logic, metadata of the things that are there in your data view, any user preferences that may have been saved as well, and multiple embedding models that help us map that natural language to a more structured query that we need for our back end systems.
- Excellent. - Thanks. Okay. So now I want to dig a little deeper into my purchases data and I want to compare a couple of months last year and what was happening with purchases last year. So I'll ask compare purchases by product. You know this is a live demo because I'm making typo mistakes. By product category from September 2024 to October 2024.
And again, the data insights agent will go through, scan through the available components, and then make sure it's giving me the most helpful analysis to answer that question. Here it's choosing the bar visualization. It's adding here this time range October on top of purchases where there's two purchases column. One is for October, one's for September. And then it also adds in this percent change column to show the difference between what's happening.
Nice. Yeah. So I also performed a round of applause for our engineering team when they built this out. We're very excited about it. I think that this, even for advanced users, saves quite a bit of time, so even if I was an advanced user, this would take me three to five minutes, I then generated this just in a few seconds. For a less experienced user who really doesn't know the structure of analysis Workspace, doesn't know which visualizations to use and when, they may not for even a few hours get to this percent change column or know how to add that in or know that you can stack filters on top of each other in one column. So all of this is done really quickly and helps them answer that question, I think, quite easily. So I want to switch topics and dig into some data on order quantity. I'd like to next understand how orders looked last December but by day of week. So I'll simply type show orders last December by day of week.
Run that, and then I can clearly see which days of the week in December had the highest orders. And here, when that runs, I can see that Sunday and Monday seem to have the highest orders. I can then start to dig into why that might be happening. Why are we seeing the highest orders on Sunday and Monday? And again, with other features like business context, like we highlighted earlier, we can start to get into some of the 'why'. With a lot of the features that we've demoed today, we're focusing on the 'what', and data insights agent, I think, helps you start to get at both the 'what' and the 'why' but here we're starting to understand what's happening in our data and start being able to dig into that way. So then lastly, I'll wrap this up by typing proportion of profit by store name-- By store name so far this year.
Run that, and then the agent will quickly build me a donut charge, break it down by store name, and I'm able to see which of my store names with associated profit have the highest profit. And I can see that Houston stands out of those stores that are tagged with profit with my highest profit that's driving most of my revenue. Okay. So let's pass it off to Prithvi to explain what this structure looks like. So after querying the data, we do have to-- We have the relevant data, and so the final step is just constructing that response. So you saw, you might have noticed a pattern. So with every prompt that Taylor was entering, there was a Freeform table, as well as a recommended visualization that was being generated. Right? So that's all happening in this response construction phase. We, again, ground the agent to ensure that it is aligned with the original user's prompt as well as the data that is available in the data view that minimizes all that hallucination. The response is structured in a way that analysis Workspace can render, and that generates a Freeform table and a visualization. The technologies under that, again, we do a little bit of similarity search. So every time you enter a prompt, there's different terminologies in your prompt and we have to run a similarity search against any of the data that you have in your data view to identify the right dimension, the metrics, segment names, things like that. So we find the closest match to identify those components. And a combination of large language model and propriety models to understand whether we have to update an existing panel or create a new visualization, new panel for every prompt, as well as any clarification questions that may be needed. If the prompt is too ambiguous or the terminology is too ambiguous, then we will generate a clarification question so you, as a user, can tell us specifically what you were thinking.
So this is the overall flow that you saw today. It has a very strong prompt comprehension unit, which ensures that the queries are precise, secure, contextually relevant. It does seamlessly transform that user intent into queries and relevant visualizations. And by automating the construction of insights, you go from raw data to data storytelling very quickly, so the agent will ensure that user is spending less time assembling the reports and more time just acting on the insights directly.
So thank you for sticking with us today on our transformation. Yep. Thank you. So today, we've walked through human, cybernetics, cyborg features. Human and cybernetic have already been released, and then cyborg, we are actively working on. Like I said, the data insights agent is moving into limited beta with customers right after Summit, so if you all are interested, please come and talk to us after. But our vision is to introduce more and more agentic features into CJA as we go, building the future of autonomous AI-powered capabilities that help your users interact with Analytics Workspace in a more efficient manner. Thanks for being part of our present and for helping us form the future. So we'd like your input into that future really quickly before you leave. We have a couple more brief surveys. The first is, what do you expect GenAI to do with your data? So if you open up that PollEv app again, you should be able to access that survey. - Yeah. - I think it should update automatically. Yeah. It should update automatically. The QR code's there. The link is there. We would love to hear feedback. We have just a couple more questions, and then we'll be all done.
Okay. Feedback starting to come in. Love that? Find insights I don't ask for.
Still being determined. Okay.
Attribution. Nice. [Man] Hi. Hi. Yeah. Are you planning to add company's own business knowledge or, like, business context to this? Yes. That is part of the plan for the Brand Brain that you saw. - Yeah. - Cool. And how about these, data catalog descriptions? Are they used, in those, language models and AI agents? They will be. They don't yet but they will be. - Cool. Thanks. - We'll skip to the Q&As. Yep. Thank you, guys. Thank you so much for coming.
Thank you, guys. [Music]